 maths89898:
Help with science please?
 lyds:
lyds:
sure
lyds:
what is it
maths89898:
okay but it's kind of confusing
lyds:
hit me
maths89898:
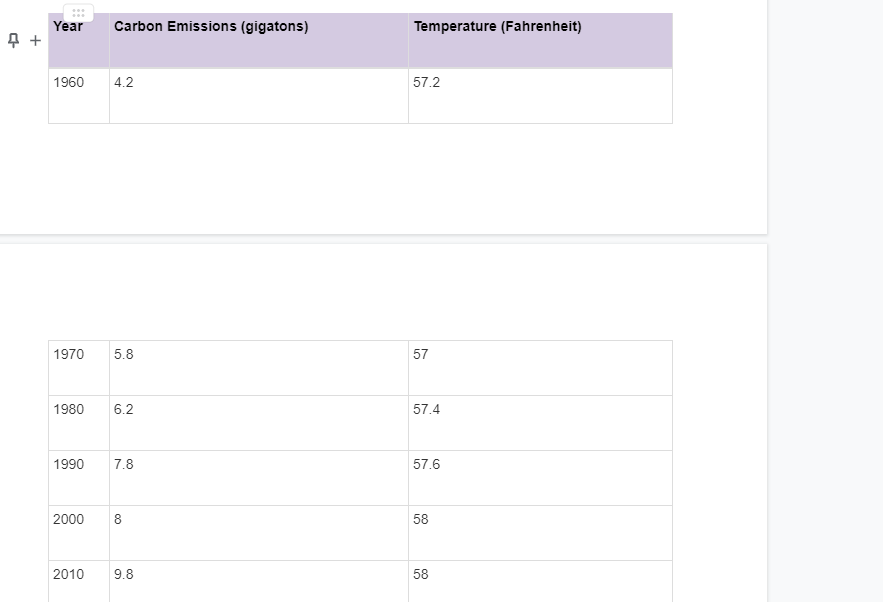
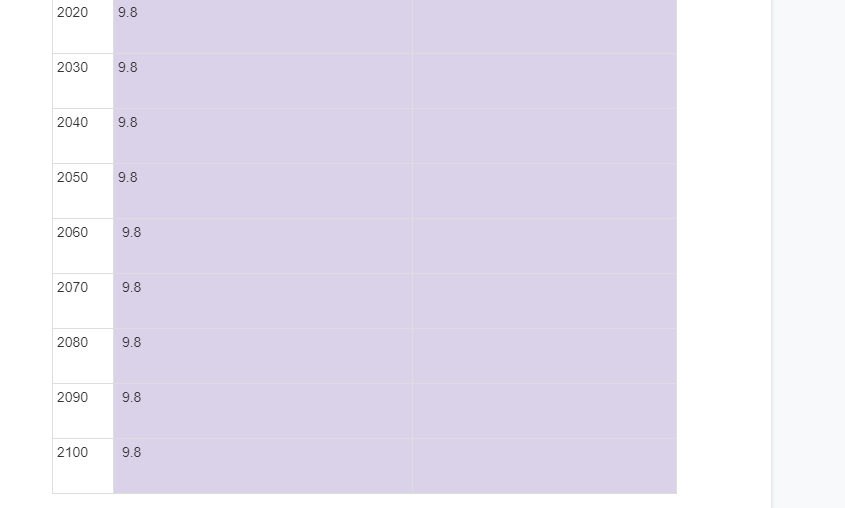
For each scenario, record the carbon dioxide emission rate and the global temperature. The data for the years 1960–2010 are already filled out for you. Skilled Scientist level from Rubric: Data were recorded and analyzed accurately for each trial; observations include important details, such as measurement values, graphs, and calculations as well as other observable details when appropriate. Scenario One: Carbon dioxide emissions stay the same Set the carbon dioxide emissions rate to 9.8 gigatons. Set the time step size to 10 years. Select step forward until you have the data through the year 2110. Record the data in the table below.
lyds:
hmm
maths89898:
let me send u the graph
 lyds:
lyds:
https://www.coursehero.com/file/84619380/Copy-of-305-The-Atmosphere-and-You-Lab-Report-ivette-docx/
lyds:
look at that it might help
maths89898:
I can't pay for that
maths89898:
it costs money to see it
lyds:
ok ummm hold on
 aldyn:
I'll help
aldyn:
I'm good at this stuff
maths89898:
okay can u find the missing temperature shown in my pictures?
maths89898:
They didn't tell me what type of pattern I needed and ive been stuck on this for eight days
aldyn:
ok
maths89898:
does anybody get what the instructions are trying to say???
maths89898:
omg tysm, if u dont mind can u explain how u got it?
maths89898:
well tysm for this even tho i didnt get the instructions!
maths89898:
it'll help me with my homework : D
aldyn:
np
Join our real-time social learning platform and learn together with your friends!
 natalieee:
who else wants a job in biology? I love biomedical science and want to work with
natalieee:
who else wants a job in biology? I love biomedical science and want to work with
 Twaylor:
Time flies doesn't it? I tried to not be the second squeaky wheel of the household and ended up hurting myself and others severely.
Twaylor:
Time flies doesn't it? I tried to not be the second squeaky wheel of the household and ended up hurting myself and others severely.
 clllaaaaaire:
any tips? the quality isn't the best because I am using this site on my computer
clllaaaaaire:
any tips? the quality isn't the best because I am using this site on my computer
 Midnight97:
Kinda a roleplay story between me and my friend enjoy... Part one Forgive me for all the screenshots.
Midnight97:
Kinda a roleplay story between me and my friend enjoy... Part one Forgive me for all the screenshots.
 StevenisGhost:
what type of song should I make next, and will y'all go check out my new song on
Midnight97:
My drawing sure changed over the years look at these two pictures from 2024 to no
StevenisGhost:
what type of song should I make next, and will y'all go check out my new song on
Midnight97:
My drawing sure changed over the years look at these two pictures from 2024 to no
 EdwinJsHispanic:
"poem" love is So Beautiful to have. But it's so hard to have. At this point I don't know whether its worth the wait Or if it's just millions of miles to re
EdwinJsHispanic:
"poem" love is So Beautiful to have. But it's so hard to have. At this point I don't know whether its worth the wait Or if it's just millions of miles to re
EdwinJsHispanic:
"poem" love is So Beautiful to have. But it's so hard to have. At this point I don't know whether its worth the wait Or if it's just millions of miles to re
EdwinJsHispanic:
"poem" love is So Beautiful to have. But it's so hard to have. At this point I don't know whether its worth the wait Or if it's just millions of miles to re