Ask
your own question, for FREE!
Mathematics
6 Online
 Sharkattack123:
Help ASAP
Still Need Help?
Join the QuestionCove community and study together with friends!
 Mrrippeter:
Ok so I have not done scatter plots yet I’m sorry man
Sharkattack123:
@mrrippeter wrote:
Ok so I have not done scatter plots yet I’m sorry man
 Extrinix:
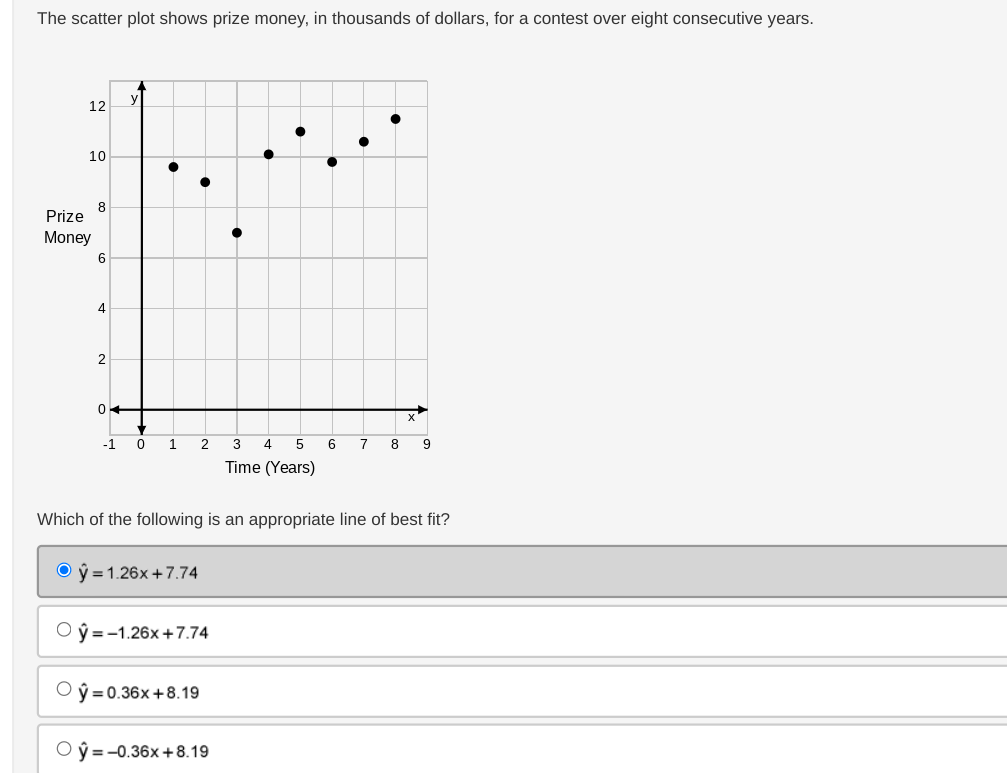
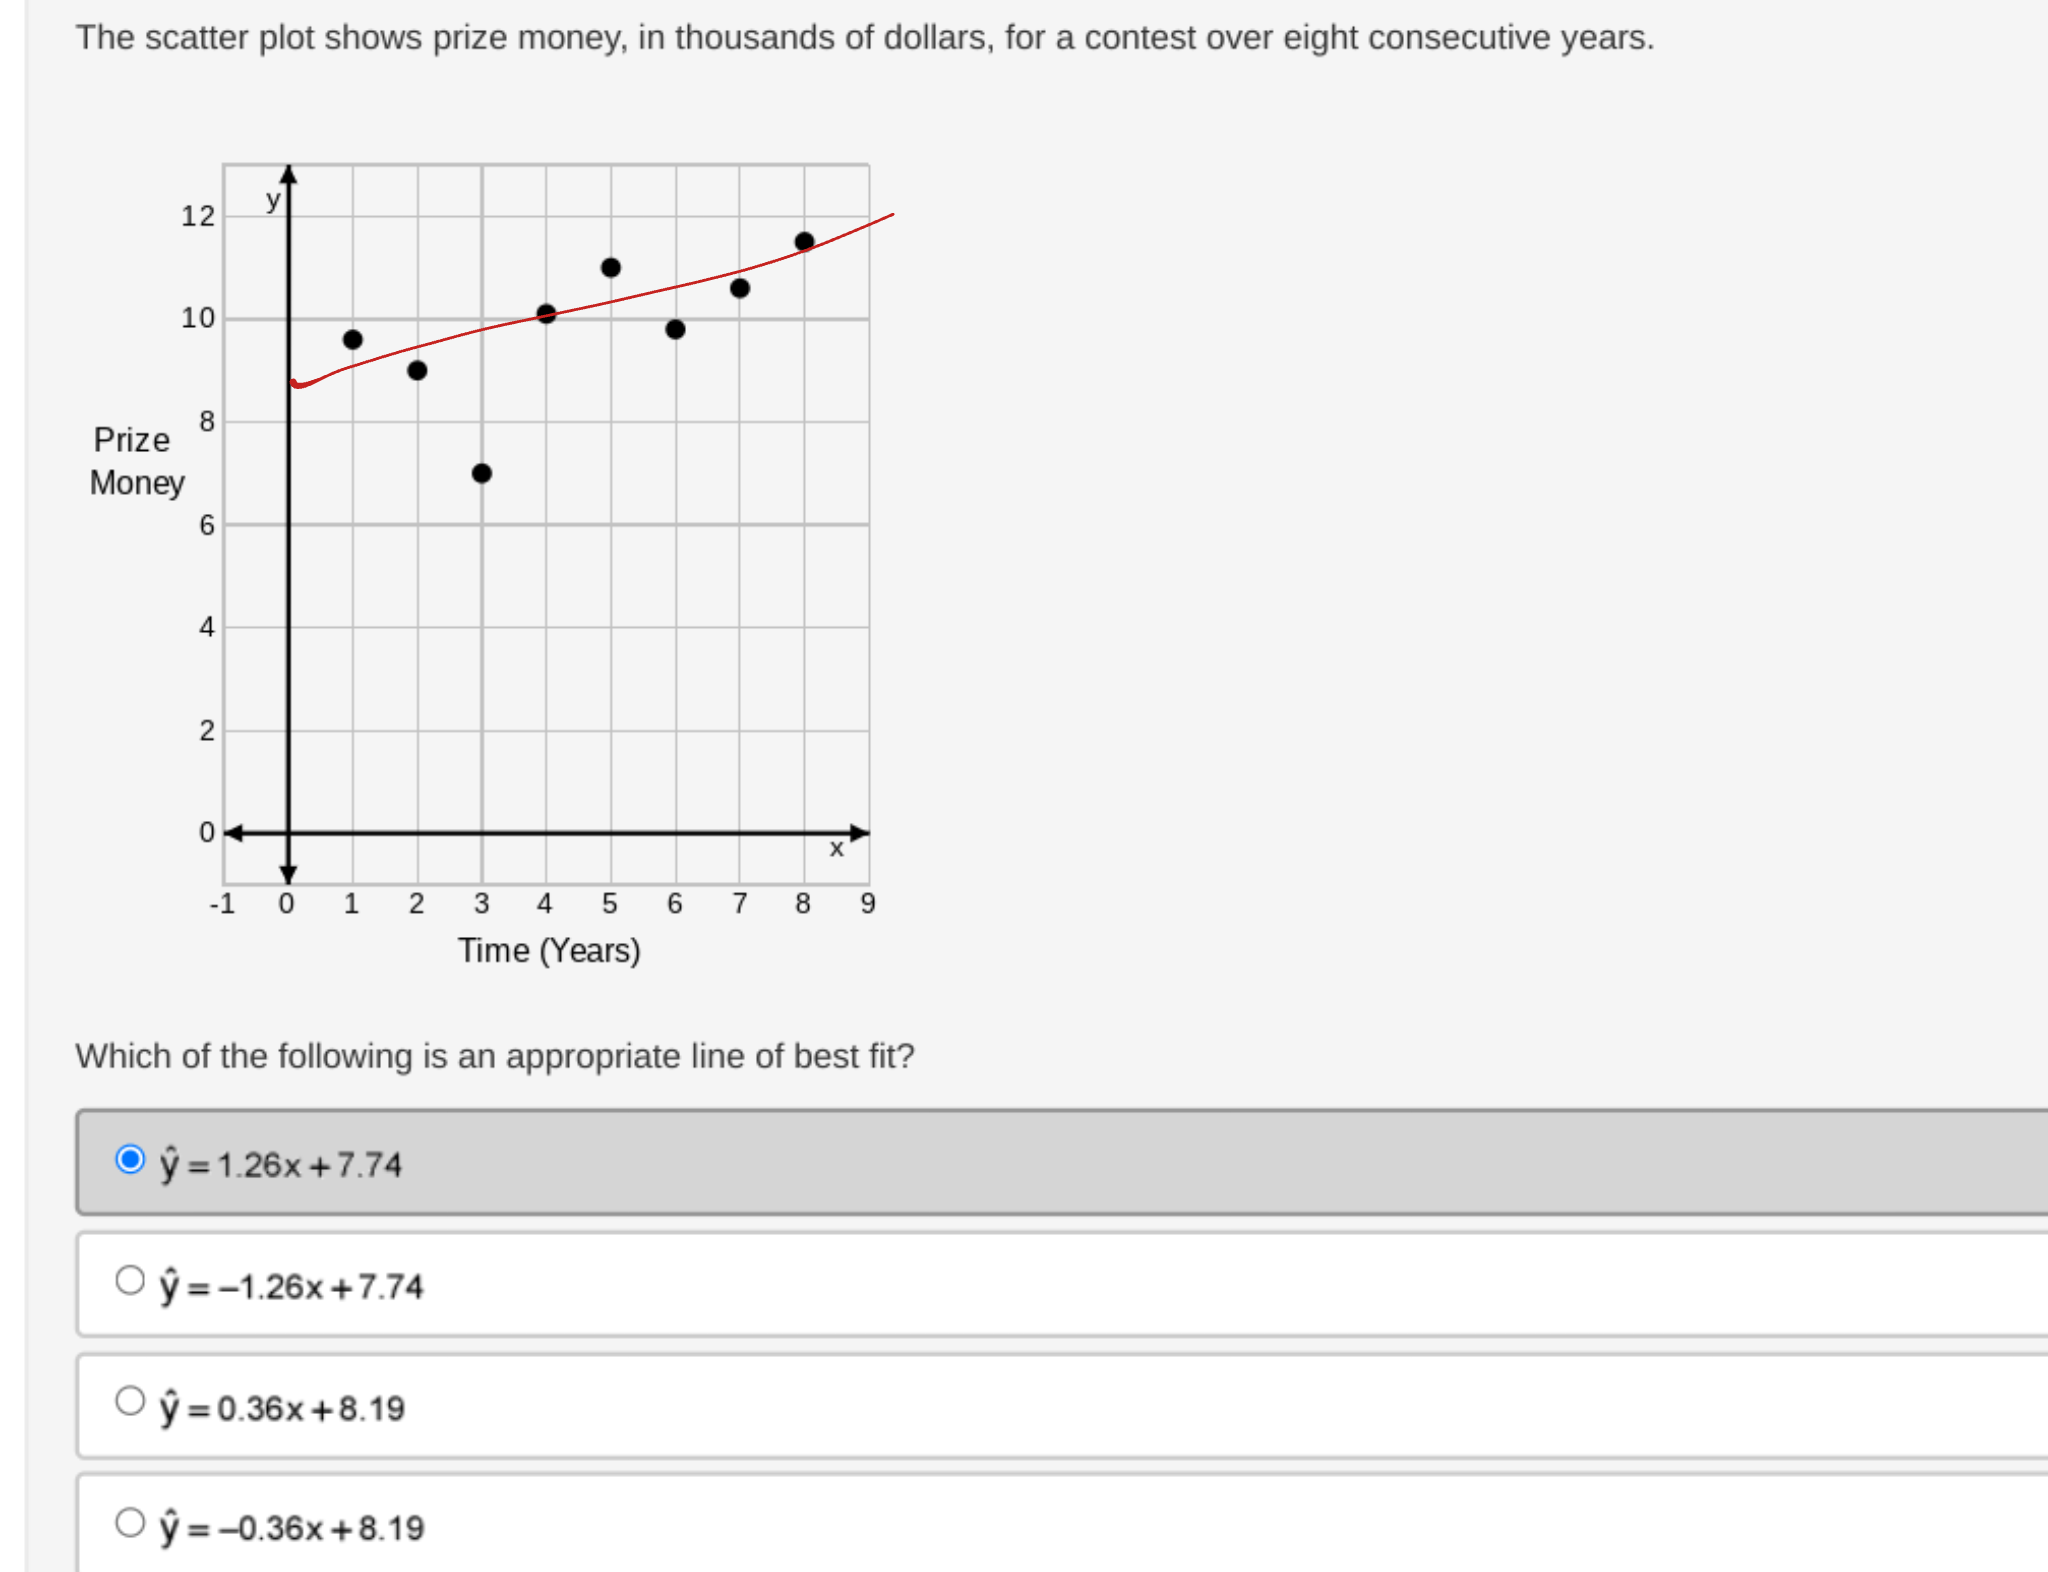
Well first off, you need to define a general "line" that the scatter plot goes on. The closest I saw was y-axis 9 to y-axis 12 (that goes across the whole graph.
 Sharkattack123:
hm
Still Need Help?
Join the QuestionCove community and study together with friends!
Sharkattack123:
yeah i dunno ;-;
 Sharkattack123:
Is it A ?
Extrinix:
(my bad, wifi shut off for the school) Okay well, after that you take rise over run of the line to find a rough estimate of the slope (\(\sf{\dfrac{3}{8}}\)) - the slope (your question has it converted from a fraction to a decimal)
Sharkattack123:
@extrinix wrote:
(my bad, wifi shut off for the school)
Okay well, after that you take rise over run of the line to find a rough estimate of the slope
(\(\sf{\dfrac{3}{8}}\)) - the slope (your question has it converted from a fraction to a decimal)
Still Need Help?
Join the QuestionCove community and study together with friends!
Extrinix:
@sharkattack123 wrote:
@extrinix wrote:
(my bad, wifi shut off for the school)
Okay well, after that you take rise over run of the line to find a rough estimate of the slope
(\(\sf{\dfrac{3}{8}}\)) - the slope (your question has it converted from a fraction to a decimal)
Sharkattack123:
is it the 3rd one
Sharkattack123:
s-o-r-r-y for taking long
Sharkattack123:
It correct ty Joshy
Can't find your answer?
Make a FREE account and ask your own questions, OR help others and earn volunteer hours!
Join our real-time social learning platform and learn together with your friends!
Join our real-time social learning platform and learn together with your friends!
Latest Questions
 natalieee:
who else wants a job in biology? I love biomedical science and want to work with
natalieee:
who else wants a job in biology? I love biomedical science and want to work with
 avisshomes:
What should I look for before choosing a co-living space in Gurgaon?
avisshomes:
What should I look for before choosing a co-living space in Gurgaon?
 Twaylor:
Time flies doesn't it? I tried to not be the second squeaky wheel of the household and ended up hurting myself and others severely.
Twaylor:
Time flies doesn't it? I tried to not be the second squeaky wheel of the household and ended up hurting myself and others severely.
 clllaaaaaire:
any tips? the quality isn't the best because I am using this site on my computer
clllaaaaaire:
any tips? the quality isn't the best because I am using this site on my computer
 Midnight97:
Kinda a roleplay story between me and my friend enjoy... Part one Forgive me for all the screenshots.
Midnight97:
Kinda a roleplay story between me and my friend enjoy... Part one Forgive me for all the screenshots.
 StevenisGhost:
what type of song should I make next, and will y'all go check out my new song on
Midnight97:
My drawing sure changed over the years look at these two pictures from 2024 to no
StevenisGhost:
what type of song should I make next, and will y'all go check out my new song on
Midnight97:
My drawing sure changed over the years look at these two pictures from 2024 to no
 EdwinJsHispanic:
"poem" love is So Beautiful to have. But it's so hard to have. At this point I don't know whether its worth the wait Or if it's just millions of miles to re
EdwinJsHispanic:
"poem" love is So Beautiful to have. But it's so hard to have. At this point I don't know whether its worth the wait Or if it's just millions of miles to re
EdwinJsHispanic:
"poem" love is So Beautiful to have. But it's so hard to have. At this point I don't know whether its worth the wait Or if it's just millions of miles to re
EdwinJsHispanic:
"poem" love is So Beautiful to have. But it's so hard to have. At this point I don't know whether its worth the wait Or if it's just millions of miles to re
natalieee:
who else wants a job in biology? I love biomedical science and want to work with
1 hour ago
1 Reply
0 Medals
2 days ago
6 Replies
0 Medals
Twaylor:
Time flies doesn't it? I tried to not be the second squeaky wheel of the household and ended up hurting myself and others severely.
4 days ago
12 Replies
2 Medals
clllaaaaaire:
any tips? the quality isn't the best because I am using this site on my computer
2 weeks ago
2 Replies
0 Medals
Midnight97:
Kinda a roleplay story between me and my friend enjoy... Part one Forgive me for all the screenshots.
3 weeks ago
2 Replies
1 Medal
StevenisGhost:
what type of song should I make next, and will y'all go check out my new song on
2 weeks ago
6 Replies
2 Medals
Midnight97:
My drawing sure changed over the years look at these two pictures from 2024 to no
3 weeks ago
6 Replies
1 Medal
EdwinJsHispanic:
"poem" love is So Beautiful to have. But it's so hard to have. At this point I don't know whether its worth the wait Or if it's just millions of miles to re
3 weeks ago
3 Replies
0 Medals
EdwinJsHispanic:
"poem" love is So Beautiful to have. But it's so hard to have. At this point I don't know whether its worth the wait Or if it's just millions of miles to re
4 weeks ago
0 Replies
0 Medals