 ashley99:
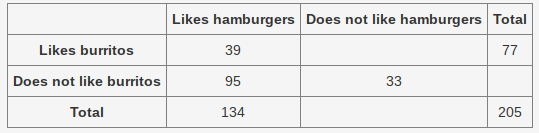
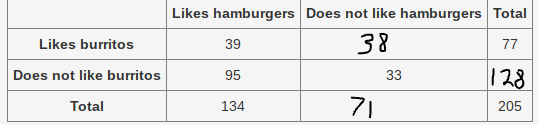
A food truck did a daily survey of customers to find their food preferences. The data is partially entered in the frequency table. Complete the table to analyze the data and answer the questions: Part A: What percentage of the survey respondents liked hamburgers but do not like burritos? Show all work. (3 points) Part B: What is the marginal relative frequency of all customers who like hamburgers? Show all work. (3 points) Part C: Which category has the lowest joint relative frequency? Show all work. (4 points)
 ashley99:
HELP!!! PLEASE!!!
 ShadowOfDeath:
Oh. For this one, you first have to fill out the chart. Are you able to do that with the information you've been given?
 ShadowOfDeath:
You already have the answer to part A. 95 people out of... 205. 95/205 is 0.46 which that would translate to 41%.
ShadowOfDeath:
46%, my bad.
ShadowOfDeath:
Just a side note, I have a terrible migraine and I'm sick with a cold, so if I mess some calculations up, feel free to correct me.
ashley99:
so basically Part A-) 0.46 Part B- is 46% How about part c?
ashley99:
ShadowOfDeath:
ShadowOfDeath:
ashley99:
Ok perfect and for part b and c sorry for the bother!
ShadowOfDeath:
No, it's not a bother at all! And part B, when I looked it up, Marginal Relative Frequency is, quoted from study.com, "the ratio between the frequency of a row total or column total to the total frequency of the data"
ashley99:
so it will be 134?
ShadowOfDeath:
If I did this correctly, the total number of people who liked hamburgers is 134 and the total amount of people is 205.
ShadowOfDeath:
ShadowOfDeath:
You have to find the ratio of 134:205
ShadowOfDeath:
Or written in another way, 134 of 205, I believe.
ShadowOfDeath:
So you divide 134/205 to find the answer to part B.
ashley99:
0.65?
ShadowOfDeath:
Which is what as a percentage?
ashley99:
65% ?
ShadowOfDeath:
Correct. The exact answer you would put is 65.37%, but we'll keep it as 65% for a simpler answer.
ashley99:
perfect!
ShadowOfDeath:
Part C is the simplest out of all of them. All you do is take each of the earlier numbers; 39,38,95, and 33 and divide all of those by 205.
ShadowOfDeath:
So 39/205 38/205 95/205 33/205
ShadowOfDeath:
Once you calculate all of those and you find the lowest percentage, that's your answer to part C.
ashley99:
33/205 is the lowest because it gave me 0.16
ShadowOfDeath:
Then the answer is 16% and that's the answer to Part C.
ShadowOfDeath:
To recap, Part A is 46% Part B is 65% (65.37%) Part C is 16%
ashley99:
Wow, you're amazing! Thank you very much for helping me; i'm beyond grateful! Have a great night!
ShadowOfDeath:
Haha, no need to thank me. Just wanted to help out! You too! Let me know if you have any more questions.
ashley99:
Great thank you again haha (;
ShadowOfDeath:
Of course;D
Join our real-time social learning platform and learn together with your friends!
 natalieee:
who else wants a job in biology? I love biomedical science and want to work with
natalieee:
who else wants a job in biology? I love biomedical science and want to work with
 Twaylor:
Time flies doesn't it? I tried to not be the second squeaky wheel of the household and ended up hurting myself and others severely.
Twaylor:
Time flies doesn't it? I tried to not be the second squeaky wheel of the household and ended up hurting myself and others severely.
 clllaaaaaire:
any tips? the quality isn't the best because I am using this site on my computer
clllaaaaaire:
any tips? the quality isn't the best because I am using this site on my computer
 Midnight97:
Kinda a roleplay story between me and my friend enjoy... Part one Forgive me for all the screenshots.
Midnight97:
Kinda a roleplay story between me and my friend enjoy... Part one Forgive me for all the screenshots.
 StevenisGhost:
what type of song should I make next, and will y'all go check out my new song on
Midnight97:
My drawing sure changed over the years look at these two pictures from 2024 to no
StevenisGhost:
what type of song should I make next, and will y'all go check out my new song on
Midnight97:
My drawing sure changed over the years look at these two pictures from 2024 to no
 EdwinJsHispanic:
"poem" love is So Beautiful to have. But it's so hard to have. At this point I don't know whether its worth the wait Or if it's just millions of miles to re
EdwinJsHispanic:
"poem" love is So Beautiful to have. But it's so hard to have. At this point I don't know whether its worth the wait Or if it's just millions of miles to re
EdwinJsHispanic:
"poem" love is So Beautiful to have. But it's so hard to have. At this point I don't know whether its worth the wait Or if it's just millions of miles to re
EdwinJsHispanic:
"poem" love is So Beautiful to have. But it's so hard to have. At this point I don't know whether its worth the wait Or if it's just millions of miles to re