 Lars:
Lars:
Graph the ordered pairs for y = 4x + 2 using x={−2, 1, 2}.
 Joe348:
oh give me one second!
Lars:
Okay :)
Joe348:
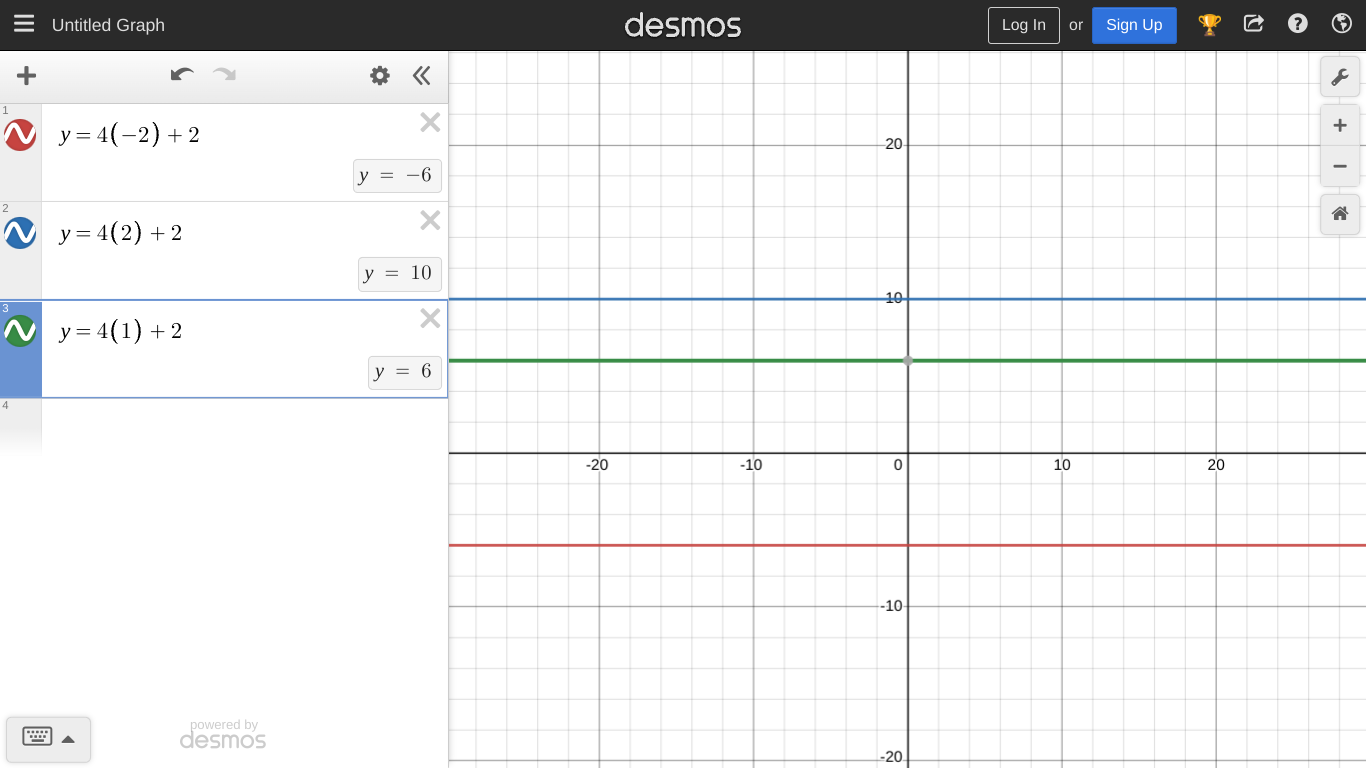
Okay so basically for each X value you plug it in the equation y=4x+2
Joe348:
So it would look like this
 Joe348:
And your X values are -2, 1, 2
Joe348:
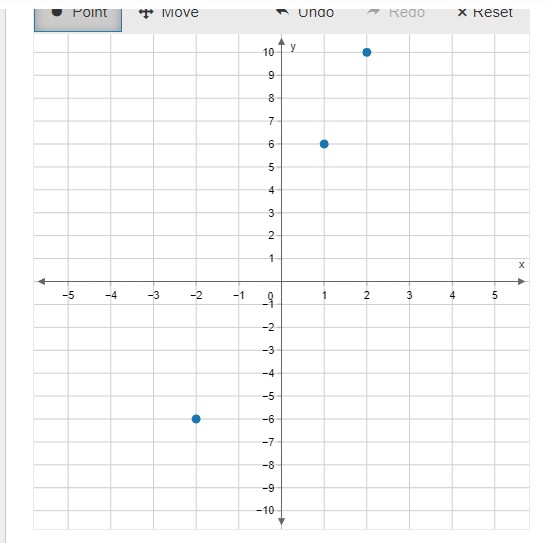
So put your X and Y values together and you'll get \[(-2,-6)\] \[(1,6)\] \[(2,10)\]
Lars:
Okay, cool thank you. For helping, could you explain a bit how i plot these on the coordinate plane?
Joe348:
Okay for (-2,-6) on your graph you'll go LEFT 2 times and from there you will go DOWN 6 times For (1,6) on your graph, you'll go RIGHT 1 time and go UP 6 times For (2,10) on your graph, you will go RIGHT 2 times and UP 10 times
 Joe348:
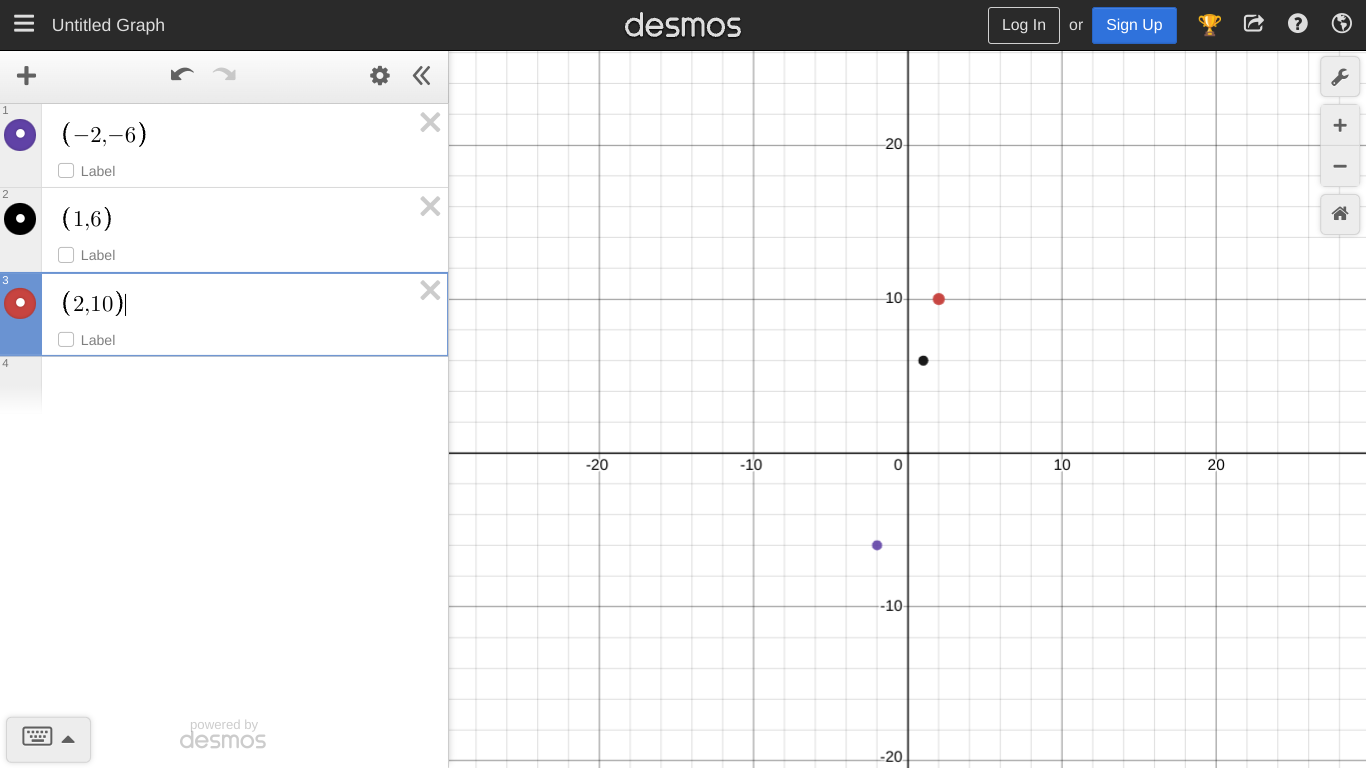
Oh wait wrong photo lol
 Joe348:
Purple dot = (-2,-6) Black dot= (1,6) Red dot = (2,10)
Lars:
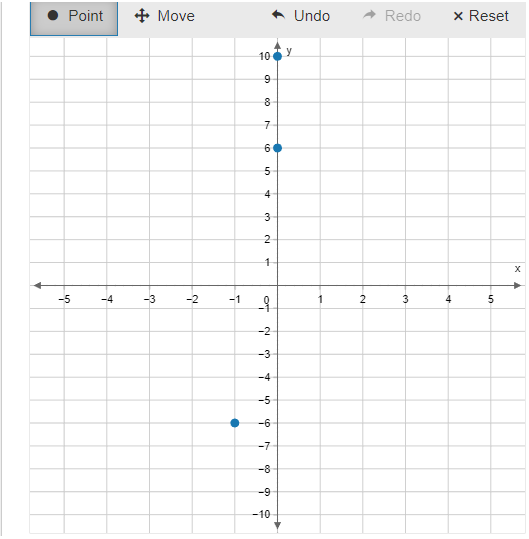
Ohh ok, that graph looks a bit different from mine. I pointed the plots does this look correct? I'll attach the screenshot in a sec hold on
 Joe348:
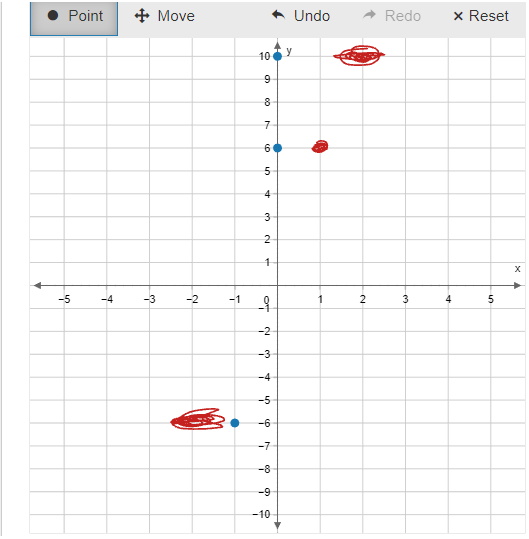
Um you're close but I'll help you out
Joe348:
This is where the dots should be
 Lars:
Lars:
I appreciate all of the help
Joe348:
Ofc glad to help and yes the graph is correct! Btw you can always use desmos.com if you need help with graphing
Lars:
Okay I will bookmark that site, thanks :)
Joe348:
Got anymore questions?
 Joe348:
No, you're right about your answer choices!
Lars:
Okay great. That's all of my questions. Thanks again for helping me!!
Joe348:
:)
Lars:
@joe So sorry for both the @ lol- I actually have one more question for you so sorry-! If you're okay with helping once more I'd much appreciate that (This is the last help question, i swear lol)
Joe348:
I only got a few minutes ill do my best to help
Lars:
okay
Joe348:
You can type it but I have to go, but im sure @jhonyy9 will be more than wiling to help! If not i'll come back tmrw same time!
Lars:
The equation y = 12x describes the amount of money Louis earns, where x is the number of hours he works, and y is the amount of money he earns. The table shows the amount of money Carl earns for different numbers of hours worked. Carl’s Earnings: s Earnings Time (h) 3, 5, 8, 10 Money earned ($) 45, 75, 120, 150 ) Draw a graph that represents their earnings over time in hours. Make sure to label the axis. Remember: there should be two lines, one for Louis and one for Carl. I have trouble plotting points is what im stuck on-
 Lars:
Lars:
If you have to go now, that's obviously okay, lol I dont mind
Join our real-time social learning platform and learn together with your friends!
 Twaylor:
Time flies doesn't it? I tried to not be the second squeaky wheel of the household and ended up hurting myself and others severely.
Twaylor:
Time flies doesn't it? I tried to not be the second squeaky wheel of the household and ended up hurting myself and others severely.
 clllaaaaaire:
any tips? the quality isn't the best because I am using this site on my computer
clllaaaaaire:
any tips? the quality isn't the best because I am using this site on my computer
 Midnight97:
Kinda a roleplay story between me and my friend enjoy... Part one Forgive me for all the screenshots.
Midnight97:
Kinda a roleplay story between me and my friend enjoy... Part one Forgive me for all the screenshots.
 StevenisGhost:
what type of song should I make next, and will y'all go check out my new song on
Midnight97:
My drawing sure changed over the years look at these two pictures from 2024 to no
StevenisGhost:
what type of song should I make next, and will y'all go check out my new song on
Midnight97:
My drawing sure changed over the years look at these two pictures from 2024 to no
 EdwinJsHispanic:
"poem" love is So Beautiful to have. But it's so hard to have. At this point I don't know whether its worth the wait Or if it's just millions of miles to re
EdwinJsHispanic:
"poem" love is So Beautiful to have. But it's so hard to have. At this point I don't know whether its worth the wait Or if it's just millions of miles to re
EdwinJsHispanic:
"poem" love is So Beautiful to have. But it's so hard to have. At this point I don't know whether its worth the wait Or if it's just millions of miles to re
EdwinJsHispanic:
"poem" love is So Beautiful to have. But it's so hard to have. At this point I don't know whether its worth the wait Or if it's just millions of miles to re
 Breathless:
I don't know if this would be considered art, but its close enough I believe, Any
Breathless:
I don't know if this would be considered art, but its close enough I believe, Any