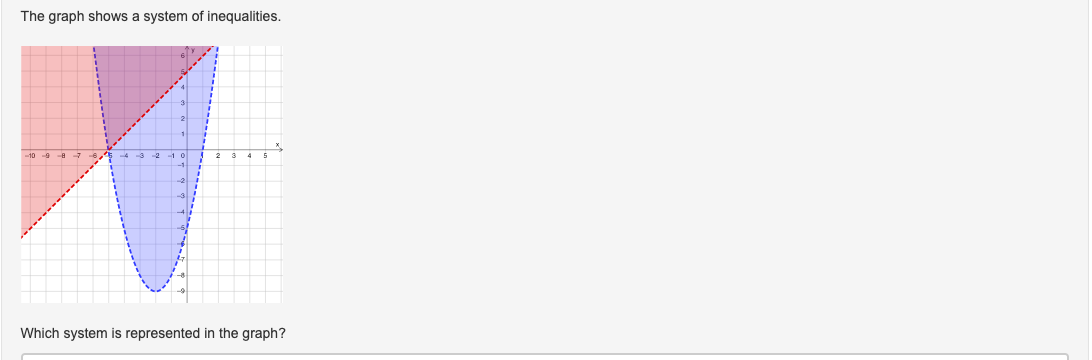
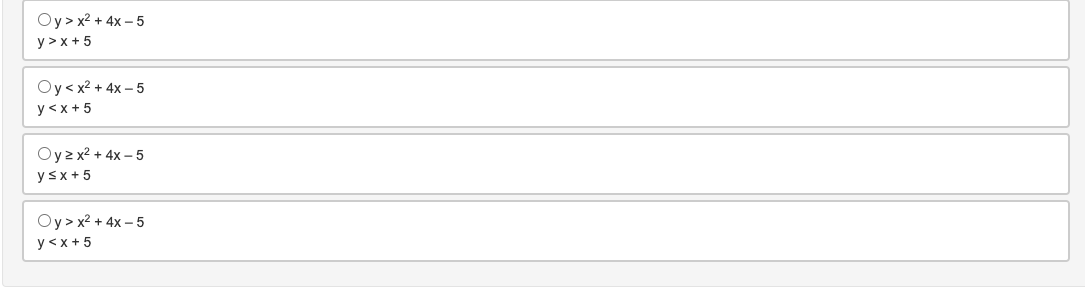
Algebra 2:The graph shows a system of inequalities. Graph of two inequalities. One is a dashed line increasing from left to right passing through negative 5 comma 0 and 0 comma 5, and it has shading above the line. The second is a dashed upward opening parabola with a vertex at negative 2 comma negative 9 and x-intercepts at negative 5 comma 0 and 1 comma 0. This parabola is shaded on the inside. Which system is represented in the graph? y > x2 + 4x – 5 y > x + 5 y < x2 + 4x – 5 y < x + 5 y ≥ x2 + 4x – 5 y ≤ x + 5 y > x2 + 4x – 5 y < x + 5
 JustBeNice:
Okay, I don't remember the name of it, but ≥ and ≤ lead to solid lines, while > and < lead to dotted lines, so to begin, is the graph dotted or solid lines?
JustBeNice:
Okay:)
JustBeNice:
Ofc. Have an AMAZING day!
okay so let me look up the graphing points and tell u what to do
Alright.
it's the third one
can you explain the work or no?
not really its hard to explain
Alright, lol, well thank you.
yw
Join our real-time social learning platform and learn together with your friends!
 natalieee:
who else wants a job in biology? I love biomedical science and want to work with
natalieee:
who else wants a job in biology? I love biomedical science and want to work with
 Twaylor:
Time flies doesn't it? I tried to not be the second squeaky wheel of the household and ended up hurting myself and others severely.
Twaylor:
Time flies doesn't it? I tried to not be the second squeaky wheel of the household and ended up hurting myself and others severely.
 clllaaaaaire:
any tips? the quality isn't the best because I am using this site on my computer
clllaaaaaire:
any tips? the quality isn't the best because I am using this site on my computer
 Midnight97:
Kinda a roleplay story between me and my friend enjoy... Part one Forgive me for all the screenshots.
Midnight97:
Kinda a roleplay story between me and my friend enjoy... Part one Forgive me for all the screenshots.
 StevenisGhost:
what type of song should I make next, and will y'all go check out my new song on
Midnight97:
My drawing sure changed over the years look at these two pictures from 2024 to no
StevenisGhost:
what type of song should I make next, and will y'all go check out my new song on
Midnight97:
My drawing sure changed over the years look at these two pictures from 2024 to no
 EdwinJsHispanic:
"poem" love is So Beautiful to have. But it's so hard to have. At this point I don't know whether its worth the wait Or if it's just millions of miles to re
EdwinJsHispanic:
"poem" love is So Beautiful to have. But it's so hard to have. At this point I don't know whether its worth the wait Or if it's just millions of miles to re
EdwinJsHispanic:
"poem" love is So Beautiful to have. But it's so hard to have. At this point I don't know whether its worth the wait Or if it's just millions of miles to re
EdwinJsHispanic:
"poem" love is So Beautiful to have. But it's so hard to have. At this point I don't know whether its worth the wait Or if it's just millions of miles to re