 xelphi:
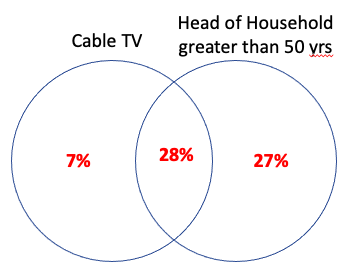
A marketing department of a cable company is doing research in their area to see how many families have cable television at home. They are also comparing this to the age of the head of the household. The Venn diagram shows the results below. Analyze the data to find the probability a household does not have cable and the head of household is less than or equal to 50 years old. (6 points)
 xelphi:
i don't get it, can't i just add the three percentages together and then subtract that by 100?
 Arieonna:
wow this is tricky i think u could do that but not sure
xelphi:
how else can you do it
xelphi:
my form will close in a few seconds
Arieonna:
good question i was reading this trying to figure it out and cant understand this at all
 Choose:
Arieonna:
Choose:
Choose:
If you would like to discuss it further, please feel free to DM me.
 OLIVER69:
So in order to find the answer you would add 28 + 27 + 7 which equals 62, then subtract that by 50 which gives you 12. And that is your answer 12%
Join our real-time social learning platform and learn together with your friends!
 Twaylor:
Time flies doesn't it? I tried to not be the second squeaky wheel of the household and ended up hurting myself and others severely.
Twaylor:
Time flies doesn't it? I tried to not be the second squeaky wheel of the household and ended up hurting myself and others severely.
 clllaaaaaire:
any tips? the quality isn't the best because I am using this site on my computer
clllaaaaaire:
any tips? the quality isn't the best because I am using this site on my computer
 Midnight97:
Kinda a roleplay story between me and my friend enjoy... Part one Forgive me for all the screenshots.
Midnight97:
Kinda a roleplay story between me and my friend enjoy... Part one Forgive me for all the screenshots.
 StevenisGhost:
what type of song should I make next, and will y'all go check out my new song on
Midnight97:
My drawing sure changed over the years look at these two pictures from 2024 to no
StevenisGhost:
what type of song should I make next, and will y'all go check out my new song on
Midnight97:
My drawing sure changed over the years look at these two pictures from 2024 to no
 EdwinJsHispanic:
"poem" love is So Beautiful to have. But it's so hard to have. At this point I don't know whether its worth the wait Or if it's just millions of miles to re
EdwinJsHispanic:
"poem" love is So Beautiful to have. But it's so hard to have. At this point I don't know whether its worth the wait Or if it's just millions of miles to re
EdwinJsHispanic:
"poem" love is So Beautiful to have. But it's so hard to have. At this point I don't know whether its worth the wait Or if it's just millions of miles to re
EdwinJsHispanic:
"poem" love is So Beautiful to have. But it's so hard to have. At this point I don't know whether its worth the wait Or if it's just millions of miles to re
 Breathless:
I don't know if this would be considered art, but its close enough I believe, Any
Breathless:
I don't know if this would be considered art, but its close enough I believe, Any