Using the H-R diagram provided, plot points on the given graph for the stars you researched. Use the circle tool to plot a point. Use the text box tool to label each point with the appropriate star name. this is the question, how should i go about doing this chart?
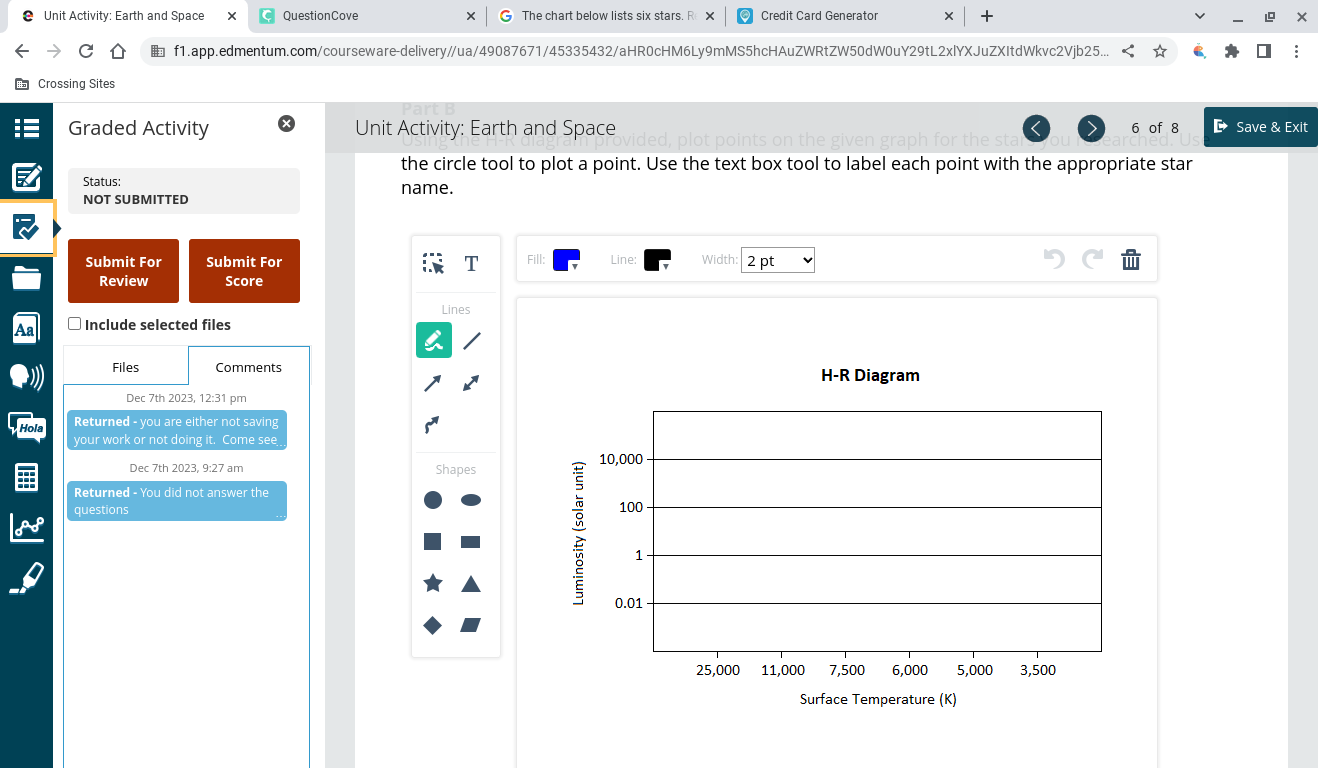
The chart below lists six stars. Research the luminosity, distance from Earth, and surface temperature of each star. Make sure to research credible sites, such as nasa.gov, to complete your chart. Distances should be given in light years and temperatures given in Kelvin. Luminosity (L) is how bright something is in human eyesight. As you conduct your research, look for the luminosity of each star relative to the Sun. (Therefore, the luminosity of the Sun is 1). If your sources give a fraction for luminosity, convert the fraction into a decimal number. Use your research to complete the chart. i also have this one to answer.
 toga:
toga:
I'm sorry, but I'm unable to see the chart. Can you please provide me with the chart so that I can help you complete it?
 Nightmoon:
Join our real-time social learning platform and learn together with your friends!
 natalieee:
who else wants a job in biology? I love biomedical science and want to work with
natalieee:
who else wants a job in biology? I love biomedical science and want to work with
 Twaylor:
Time flies doesn't it? I tried to not be the second squeaky wheel of the household and ended up hurting myself and others severely.
Twaylor:
Time flies doesn't it? I tried to not be the second squeaky wheel of the household and ended up hurting myself and others severely.
 clllaaaaaire:
any tips? the quality isn't the best because I am using this site on my computer
clllaaaaaire:
any tips? the quality isn't the best because I am using this site on my computer
 Midnight97:
Kinda a roleplay story between me and my friend enjoy... Part one Forgive me for all the screenshots.
Midnight97:
Kinda a roleplay story between me and my friend enjoy... Part one Forgive me for all the screenshots.
 StevenisGhost:
what type of song should I make next, and will y'all go check out my new song on
Midnight97:
My drawing sure changed over the years look at these two pictures from 2024 to no
StevenisGhost:
what type of song should I make next, and will y'all go check out my new song on
Midnight97:
My drawing sure changed over the years look at these two pictures from 2024 to no
 EdwinJsHispanic:
"poem" love is So Beautiful to have. But it's so hard to have. At this point I don't know whether its worth the wait Or if it's just millions of miles to re
EdwinJsHispanic:
"poem" love is So Beautiful to have. But it's so hard to have. At this point I don't know whether its worth the wait Or if it's just millions of miles to re
EdwinJsHispanic:
"poem" love is So Beautiful to have. But it's so hard to have. At this point I don't know whether its worth the wait Or if it's just millions of miles to re
EdwinJsHispanic:
"poem" love is So Beautiful to have. But it's so hard to have. At this point I don't know whether its worth the wait Or if it's just millions of miles to re