 Phantomdex:
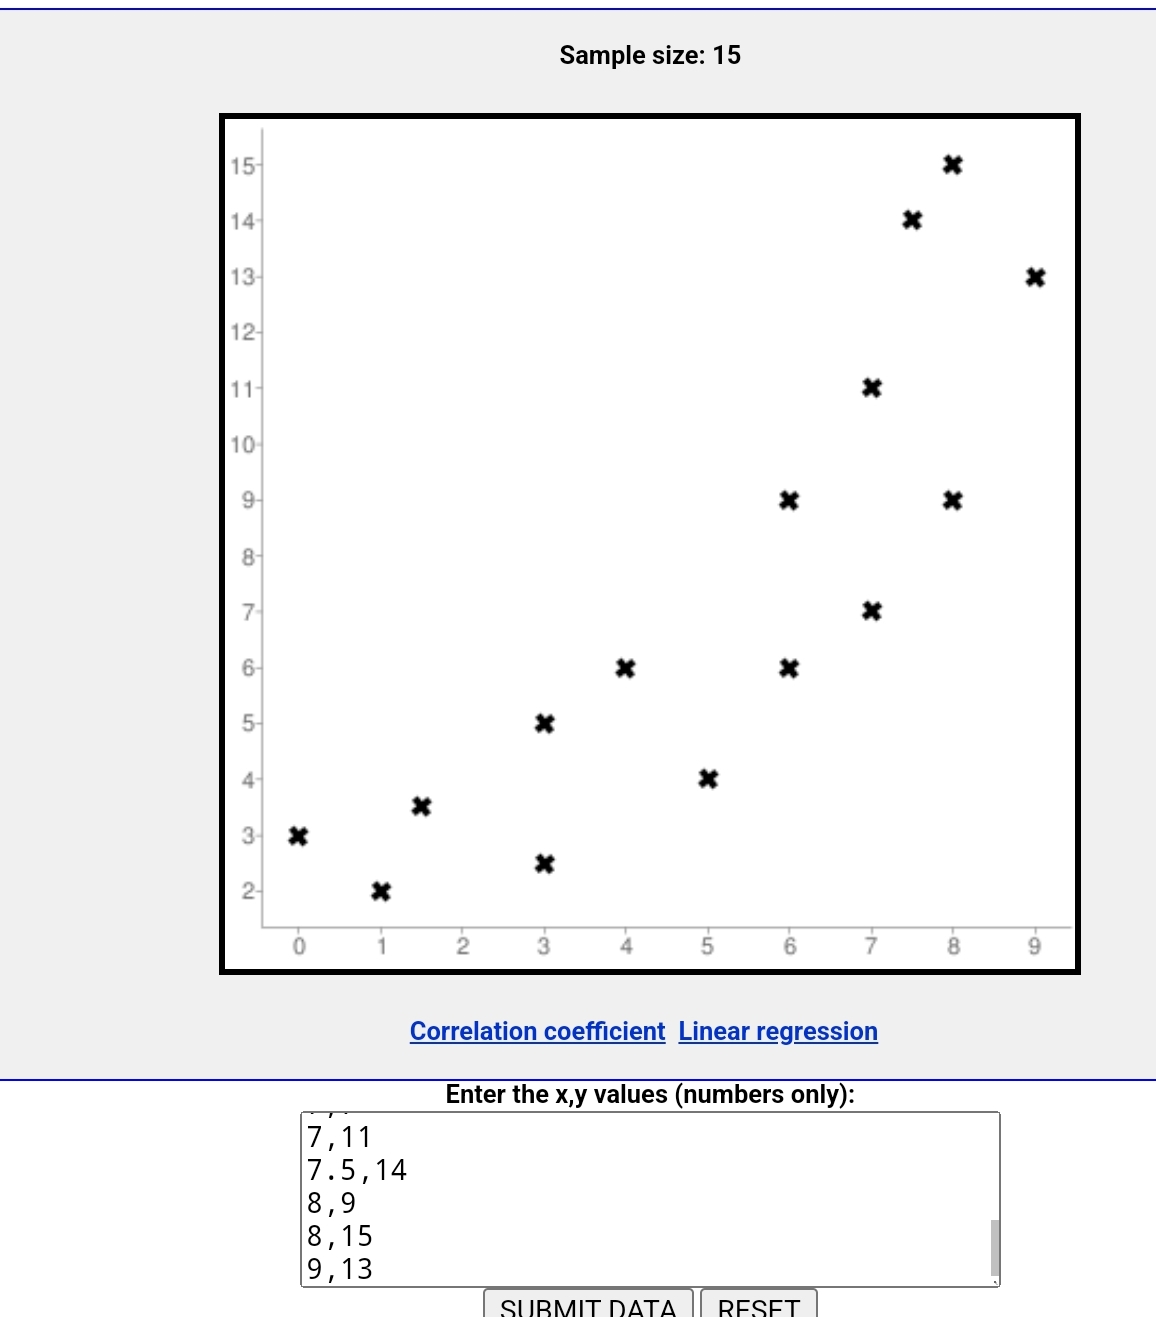
Which of the following is the most appropriate model for the given data? A scatter plot contains the ordered pairs 0,3 and 1,2 and 1.5,3.5 and 3,2.5 and 3,5 and 4,6 and 5,4 and 6,6 and 6,9 and 7,7 and 7,11 and 7.5,14 and 8,9 and 8,15 and 9,13. ŷ = 1.25(2)x ŷ = 1.4x + 0.5 ŷ = 2(1.25)x ŷ = 0.5x + 1.4

 Elsa213:
@lui0210 might be able to help. c: <3
Phantomdex:
I just need to get my math done and not fail sobs
 Lui0210:
Have you tried plotting the points?
 Lui0210:
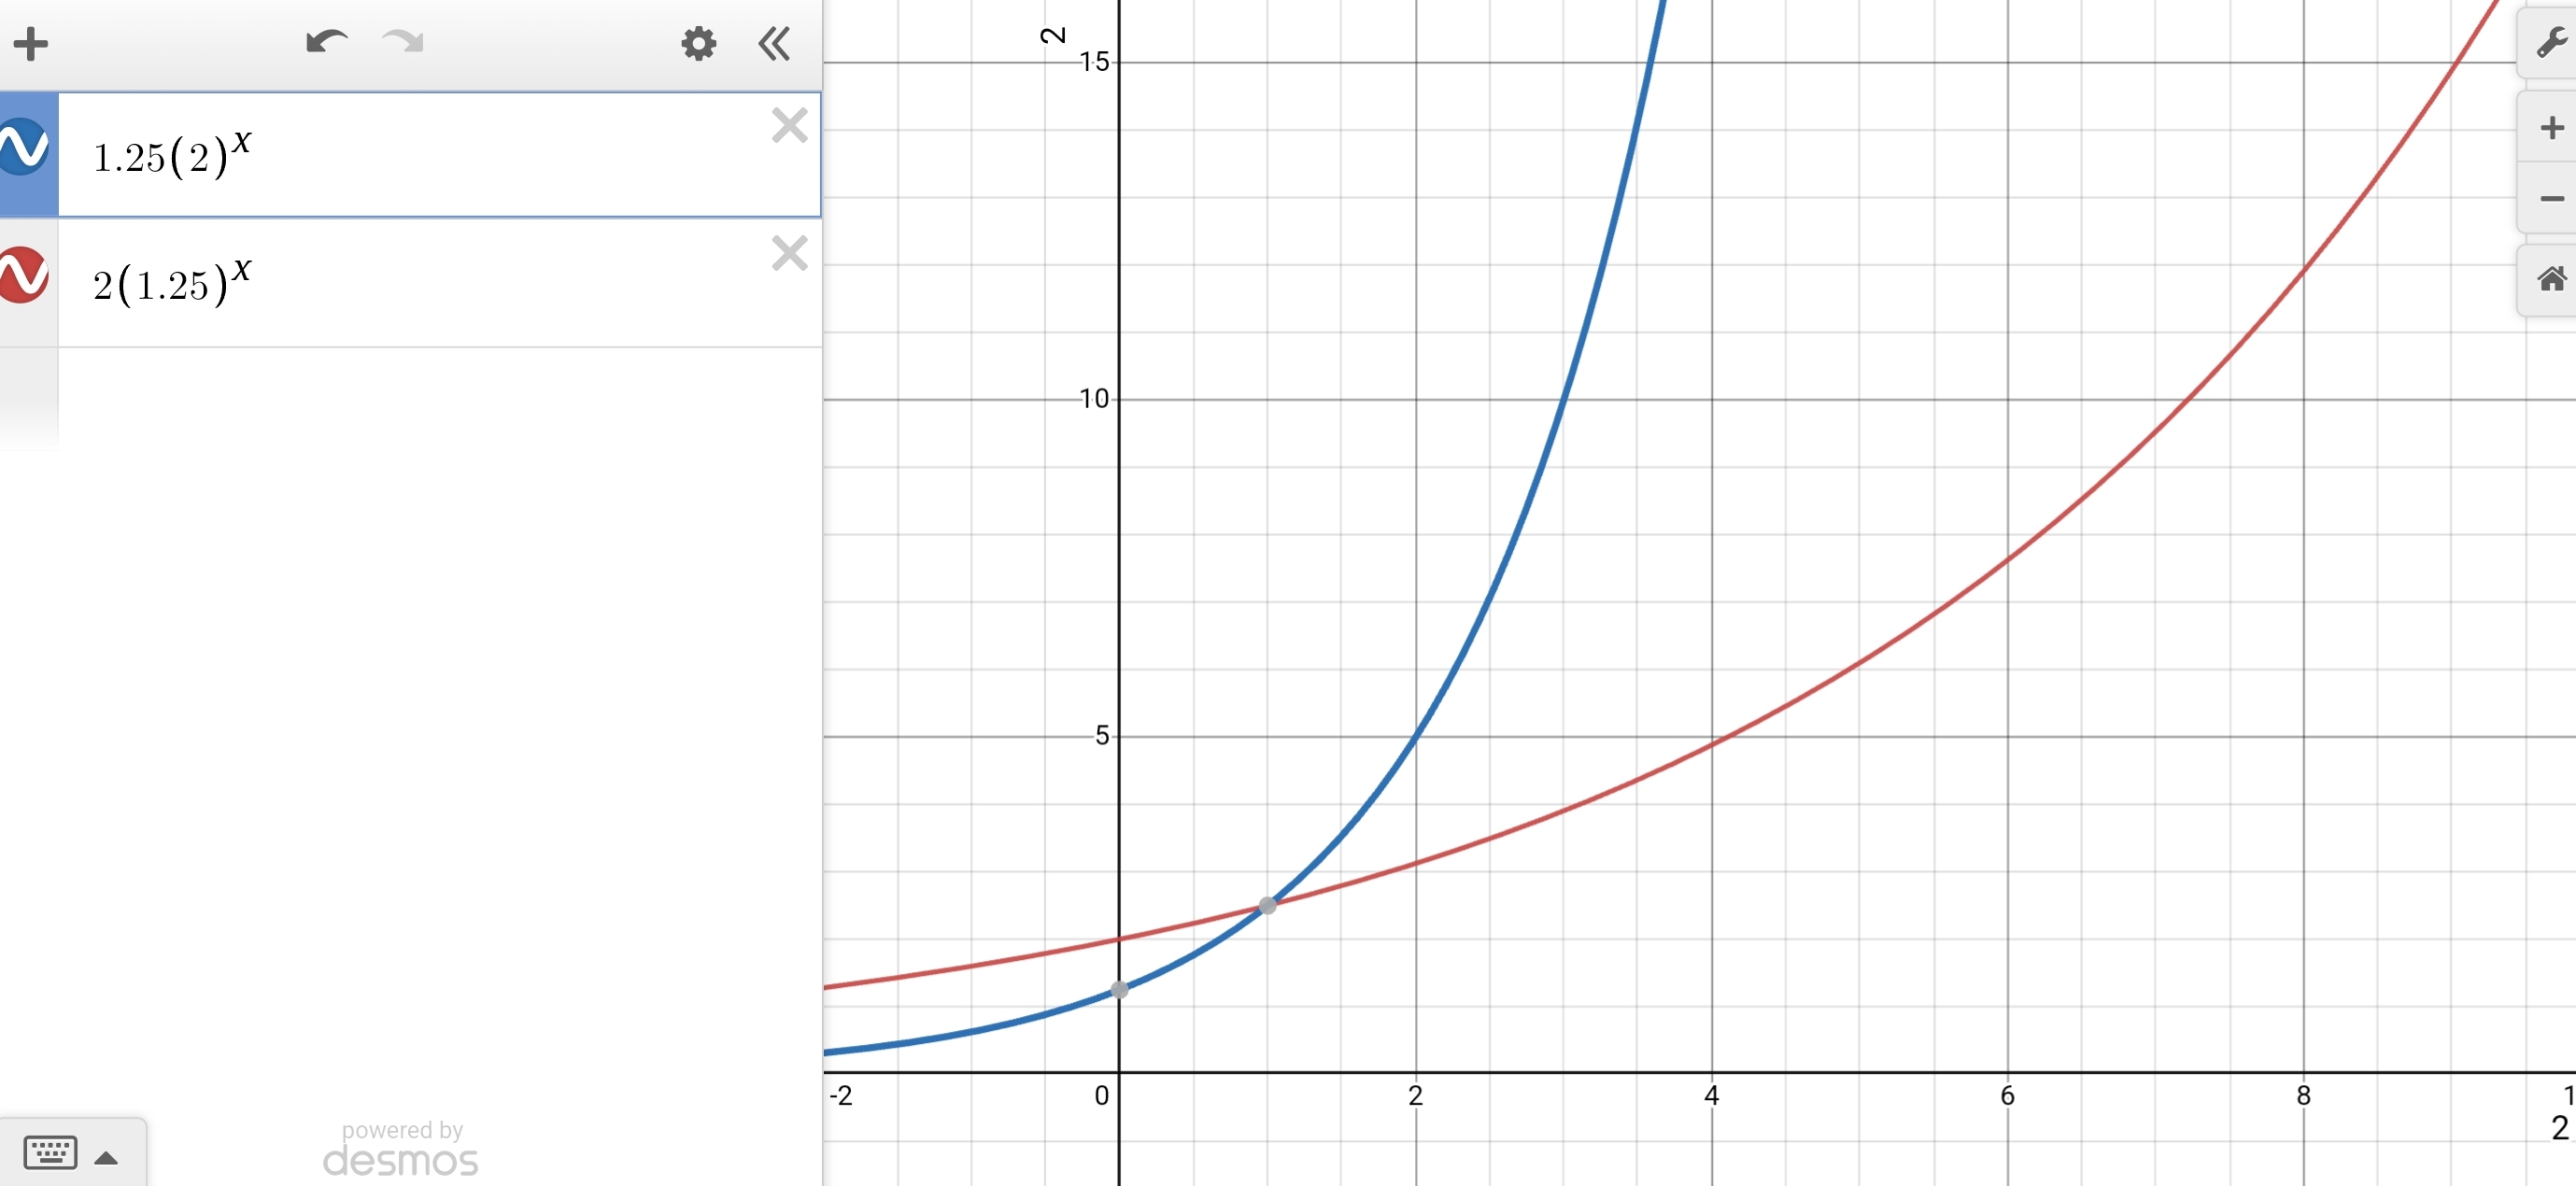
If you notice, it looks just slightly like an exponential curve. Which means you can eliminate equations that are linear (b, d)
Phantomdex:
I see
Lui0210:
If you plot the last two, you can see that option C, is close to the points you plotted. A has a steep rise
 Treeko:
Phantomdex:
So, C would be the correct answer seeing as it isn't linear and doesn't have a steep rise but s=instead matches the points more than the rest?
Lui0210:
Based on my few mins of putting 2 and 2 together, yes lol But you might wanna check yourself by just plotting the equations. I would but I am in class atm..
Phantomdex:
Oh that's fine, thank you for helping me! I would ask if you could help me with a few more but I don't want to bother you while you're in class..
Lui0210:
You can just post them as separate questions, someone else might be able to help (:
Phantomdex:
Ty :]
Join our real-time social learning platform and learn together with your friends!
 Twaylor:
Time flies doesn't it? I tried to not be the second squeaky wheel of the household and ended up hurting myself and others severely.
Twaylor:
Time flies doesn't it? I tried to not be the second squeaky wheel of the household and ended up hurting myself and others severely.
 clllaaaaaire:
any tips? the quality isn't the best because I am using this site on my computer
clllaaaaaire:
any tips? the quality isn't the best because I am using this site on my computer
 Midnight97:
Kinda a roleplay story between me and my friend enjoy... Part one Forgive me for all the screenshots.
Midnight97:
Kinda a roleplay story between me and my friend enjoy... Part one Forgive me for all the screenshots.
 StevenisGhost:
what type of song should I make next, and will y'all go check out my new song on
Midnight97:
My drawing sure changed over the years look at these two pictures from 2024 to no
StevenisGhost:
what type of song should I make next, and will y'all go check out my new song on
Midnight97:
My drawing sure changed over the years look at these two pictures from 2024 to no
 EdwinJsHispanic:
"poem" love is So Beautiful to have. But it's so hard to have. At this point I don't know whether its worth the wait Or if it's just millions of miles to re
EdwinJsHispanic:
"poem" love is So Beautiful to have. But it's so hard to have. At this point I don't know whether its worth the wait Or if it's just millions of miles to re
EdwinJsHispanic:
"poem" love is So Beautiful to have. But it's so hard to have. At this point I don't know whether its worth the wait Or if it's just millions of miles to re
EdwinJsHispanic:
"poem" love is So Beautiful to have. But it's so hard to have. At this point I don't know whether its worth the wait Or if it's just millions of miles to re
 Breathless:
I don't know if this would be considered art, but its close enough I believe, Any
Breathless:
I don't know if this would be considered art, but its close enough I believe, Any