 Alexis1415:
For @bigjoe88 For the three-part question that follows, provide your answer to each question in the given workspace. Be sure to clearly label each part of your response as Part A, Part B, and Part C. Part A: Multiple random samples of approximate amounts of screen time (in minutes) for -year-old children in the area are recorded below
Alexis1415:
If there is more information without graphs could you text it on here as best as your capability, for users to be able to better understand and cooperate?
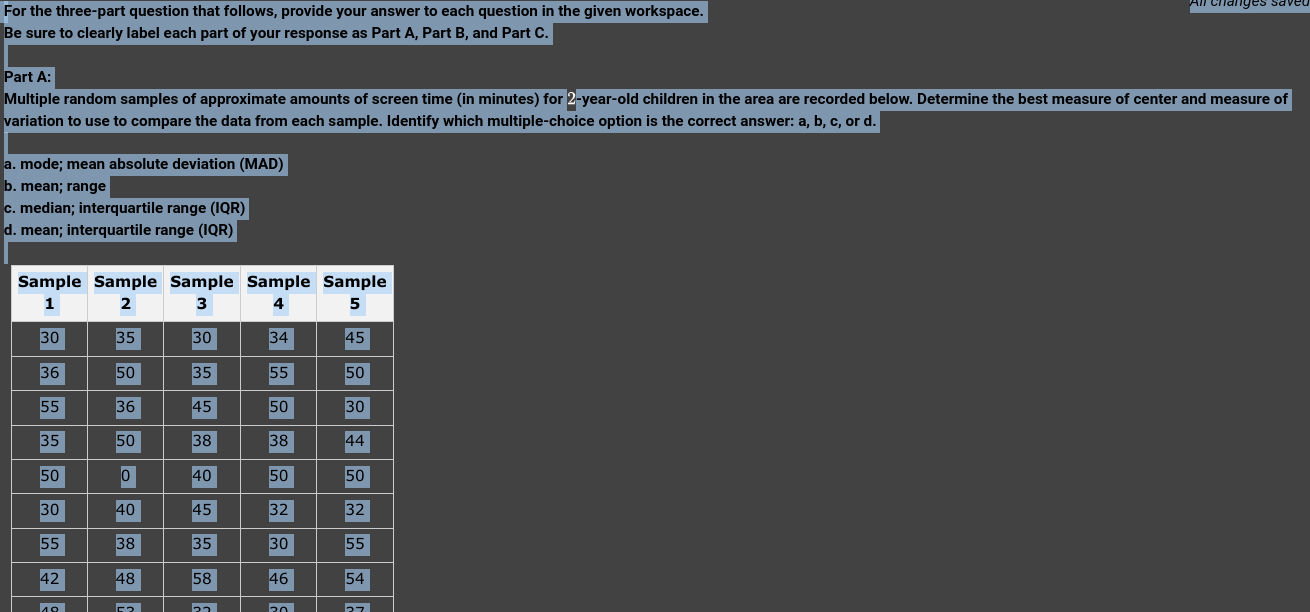
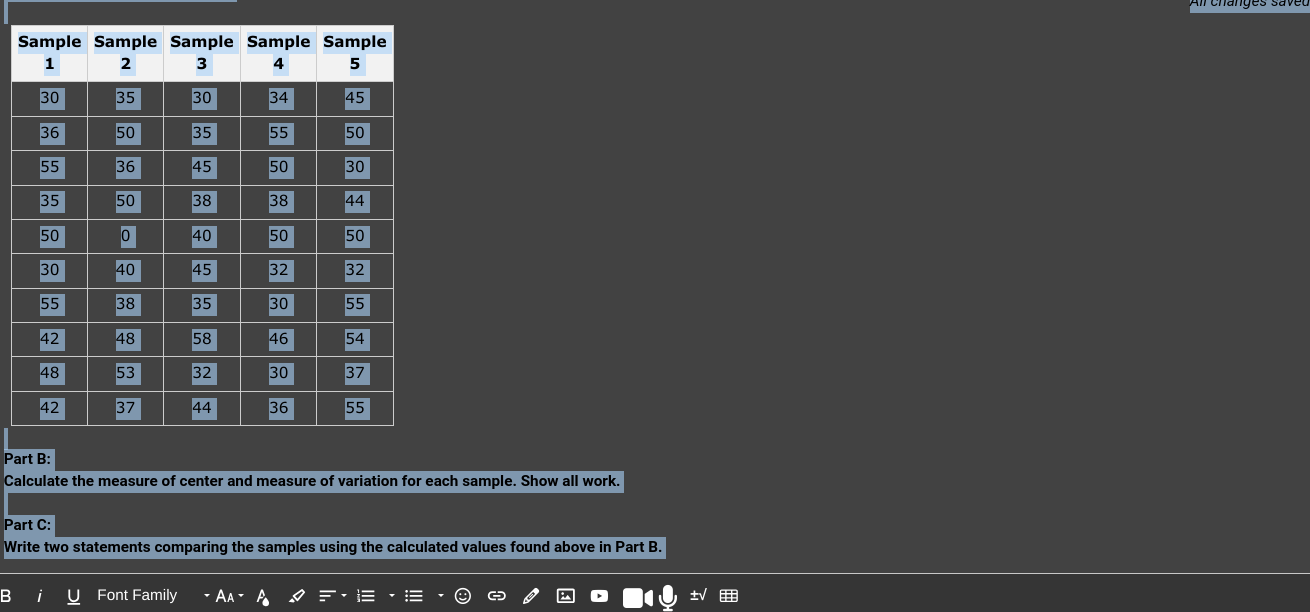
Here are both SS of the Question
Alexis1415:
Thank you 🙏
your welcome
Alexis1415:
Okay so we have to find the mode; mean absolute deviation (MAD) so do you know or understand how to find the mean?
not really
Alexis1415:
I will try to explain it as best as possible, I haven't done this in a hot minute. The mean summarizes dataset with a single number representing the data’s center point. Let me give an example so I can assist, Let's say we had heights : 48, 51, 52, 54, and 56 inches. We have to find the sum of the heights. \[48+51+52+54+56=261\] Number of values we have is 5, so all the numbers except 261 Divide the sum by the number of values and you find it.
oh wait I know
Alexis1415:
Yes, so if we look at the chart what can we say the mean is?
Join our real-time social learning platform and learn together with your friends!
 natalieee:
who else wants a job in biology? I love biomedical science and want to work with
natalieee:
who else wants a job in biology? I love biomedical science and want to work with
 Twaylor:
Time flies doesn't it? I tried to not be the second squeaky wheel of the household and ended up hurting myself and others severely.
Twaylor:
Time flies doesn't it? I tried to not be the second squeaky wheel of the household and ended up hurting myself and others severely.
 clllaaaaaire:
any tips? the quality isn't the best because I am using this site on my computer
clllaaaaaire:
any tips? the quality isn't the best because I am using this site on my computer
 Midnight97:
Kinda a roleplay story between me and my friend enjoy... Part one Forgive me for all the screenshots.
Midnight97:
Kinda a roleplay story between me and my friend enjoy... Part one Forgive me for all the screenshots.
 StevenisGhost:
what type of song should I make next, and will y'all go check out my new song on
Midnight97:
My drawing sure changed over the years look at these two pictures from 2024 to no
StevenisGhost:
what type of song should I make next, and will y'all go check out my new song on
Midnight97:
My drawing sure changed over the years look at these two pictures from 2024 to no
 EdwinJsHispanic:
"poem" love is So Beautiful to have. But it's so hard to have. At this point I don't know whether its worth the wait Or if it's just millions of miles to re
EdwinJsHispanic:
"poem" love is So Beautiful to have. But it's so hard to have. At this point I don't know whether its worth the wait Or if it's just millions of miles to re
EdwinJsHispanic:
"poem" love is So Beautiful to have. But it's so hard to have. At this point I don't know whether its worth the wait Or if it's just millions of miles to re
EdwinJsHispanic:
"poem" love is So Beautiful to have. But it's so hard to have. At this point I don't know whether its worth the wait Or if it's just millions of miles to re