 AddieroniAndCheese:
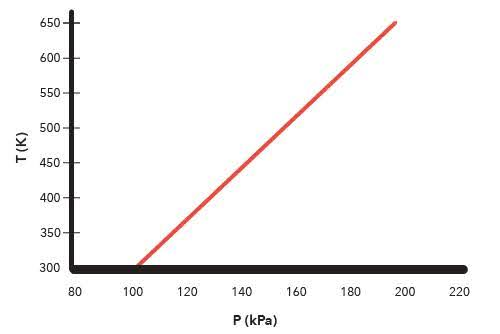
The graph below describes the temperature and pressure relationship of a gas under ideal conditions. Write 2 – 3 sentences to explain the graph. Be sure to explain what will happen to the real gas behavior as the temperature of the gas is lowered. That's the question and tbh I have no idea how this is related and this is due today womp womp does someone have chegg or like really know chem?
 bubbly1belle:
Well, what do you notice happens as the pressure P(kPa) increases?
 theydontknowmelly:
i dont know this
 Graysonunderwoods:
as you can see in this image its your y=650 and you x=200 the point (200, 650) suggests that at a temperature of 200, the pressure of the gas is approximately 650,However, based on the ideal gas law (PV = nRT), we could infer that the pressure of the gas increases with increasing temperature, and that at a temperature of 200, the gas is at a high pressure. as the temperature is lowered, the gas behavior will deviate more significantly from the ideal gas law, and the pressure will deviate from the expected decrease, often resulting in a more dramatic decrease in pressure than predicted. tho it seems like you're describing a point on a graph, rather than the graph itself.hmm not sure why i went into science but hey ig its based on it
 Blacksong:
._.
Join our real-time social learning platform and learn together with your friends!

 Twaylor:
Time flies doesn't it? I tried to not be the second squeaky wheel of the household and ended up hurting myself and others severely.
Twaylor:
Time flies doesn't it? I tried to not be the second squeaky wheel of the household and ended up hurting myself and others severely.
 clllaaaaaire:
any tips? the quality isn't the best because I am using this site on my computer
clllaaaaaire:
any tips? the quality isn't the best because I am using this site on my computer
 Midnight97:
Kinda a roleplay story between me and my friend enjoy... Part one Forgive me for all the screenshots.
Midnight97:
Kinda a roleplay story between me and my friend enjoy... Part one Forgive me for all the screenshots.
 StevenisGhost:
what type of song should I make next, and will y'all go check out my new song on
Midnight97:
My drawing sure changed over the years look at these two pictures from 2024 to no
StevenisGhost:
what type of song should I make next, and will y'all go check out my new song on
Midnight97:
My drawing sure changed over the years look at these two pictures from 2024 to no
 EdwinJsHispanic:
"poem" love is So Beautiful to have. But it's so hard to have. At this point I don't know whether its worth the wait Or if it's just millions of miles to re
EdwinJsHispanic:
"poem" love is So Beautiful to have. But it's so hard to have. At this point I don't know whether its worth the wait Or if it's just millions of miles to re
EdwinJsHispanic:
"poem" love is So Beautiful to have. But it's so hard to have. At this point I don't know whether its worth the wait Or if it's just millions of miles to re
EdwinJsHispanic:
"poem" love is So Beautiful to have. But it's so hard to have. At this point I don't know whether its worth the wait Or if it's just millions of miles to re