 Loli:
Loli:
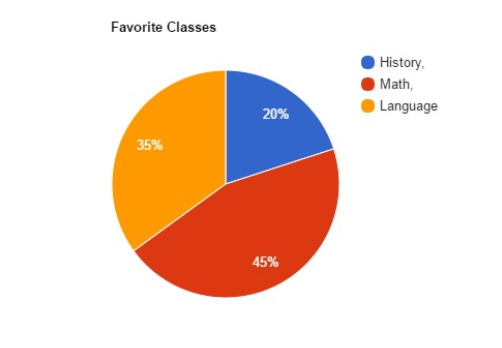
Jordan asked 20 students to select their favorite class and then recorded the results in the pie chart below. If Jordan's results represent the entire student population, which of the following statements is true. A~ If Jordan asks another 120 students, 54 students would select Math B~ If Jordan asks another 150 students, 20 students would select History. C~ If Jordan asks another 140 students, 105 students would select Math over History. D~ If Jordan asks another 120 students, 78 students would select Language Arts.
 Vocaloid:
[protip you can use @vocaloid or @username to tag someone to get their attention faster ^_^]
Vocaloid:
but anyway, let's go through the answer choices
Vocaloid:
"A~ If Jordan asks another 120 students, 54 students would select Math" according to the pie chart, 45% of students picked math so what is 45% of 120?
Loli:
45% of 120 is 54
Vocaloid:
awesome, that makes A our best answer
Loli:
Thanks a bunch c:
Join our real-time social learning platform and learn together with your friends!
 natalieee:
who else wants a job in biology? I love biomedical science and want to work with
natalieee:
who else wants a job in biology? I love biomedical science and want to work with
 Twaylor:
Time flies doesn't it? I tried to not be the second squeaky wheel of the household and ended up hurting myself and others severely.
Twaylor:
Time flies doesn't it? I tried to not be the second squeaky wheel of the household and ended up hurting myself and others severely.
 clllaaaaaire:
any tips? the quality isn't the best because I am using this site on my computer
clllaaaaaire:
any tips? the quality isn't the best because I am using this site on my computer
 Midnight97:
Kinda a roleplay story between me and my friend enjoy... Part one Forgive me for all the screenshots.
Midnight97:
Kinda a roleplay story between me and my friend enjoy... Part one Forgive me for all the screenshots.
 StevenisGhost:
what type of song should I make next, and will y'all go check out my new song on
Midnight97:
My drawing sure changed over the years look at these two pictures from 2024 to no
StevenisGhost:
what type of song should I make next, and will y'all go check out my new song on
Midnight97:
My drawing sure changed over the years look at these two pictures from 2024 to no
 EdwinJsHispanic:
"poem" love is So Beautiful to have. But it's so hard to have. At this point I don't know whether its worth the wait Or if it's just millions of miles to re
EdwinJsHispanic:
"poem" love is So Beautiful to have. But it's so hard to have. At this point I don't know whether its worth the wait Or if it's just millions of miles to re
EdwinJsHispanic:
"poem" love is So Beautiful to have. But it's so hard to have. At this point I don't know whether its worth the wait Or if it's just millions of miles to re
EdwinJsHispanic:
"poem" love is So Beautiful to have. But it's so hard to have. At this point I don't know whether its worth the wait Or if it's just millions of miles to re