 princeevee:
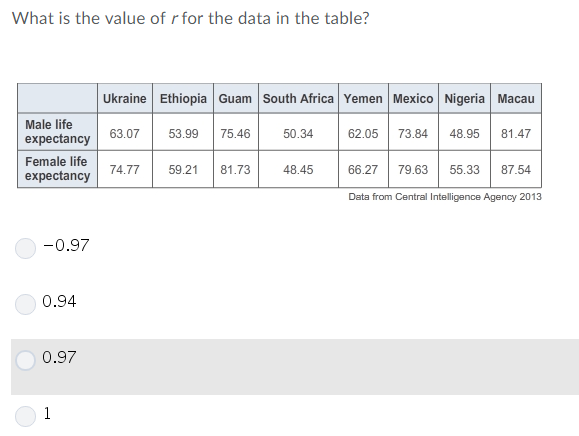
help
 princeevee:
@Shadow
 Shadow:
I'm going to be honest, that doesn't look like fun.
princeevee:
it's 12th grade math
Shadow:
@dude Any ideas besides using the formula
Shadow:
\[r = \frac{ n (\sum xy) - (\sum x)(\sum y) }{ \sqrt ([n \sum x^{2} - (\sum x)^{2}][n \sum y^{2} - (\sum y)^{2} ] }\]
Shadow:
It's not negative, and it's not perfect...so it's 0.94 or 0.97
Shadow:
This is a Finance class right?
Shadow:
Or statistics
 dude:
dude:
I did this before, its statistics
dude:
I think there was a more simple way, but I dont think I have notes from back then
Shadow:
http://www.statisticshowto.com/probability-and-statistics/correlation-coefficient-formula/ There are other formulas here but I don't understand them.
Shadow:
By the way, n is the sample size, so basically how many columns you have.
dude:
Which equation do you not understand o.o
Shadow:
The latter two
Shadow:
Only cause I have never taken a stats class, and thus, have never seen them before. The only reason I understand this one is because you encounter summation in precalculus.
dude:
Latter 2? xD
Shadow:
By the way @princeevee if you do not know what that E looking symbol means, it stands for sum. So you would just add up all the x points for \[\sum x\]
Shadow:
There are only three formulas on the website. I get the first one, latter refers to that of which is last in an arrangement.
Shadow:
I have to go to class, so if you feel like giving this a shot or waiting for a math powerhouse like @Angle or Vocaloid is she isn't busy...
Shadow:
if*
 mhchen:
Yeh this is definitely statistics. It's a calculator class so you can just use this. https://www.socscistatistics.com/tests/pearson/Default2.aspx They also grade you on interpreting 'r' so watch out for that. You use a TI-84 NSpire calculator for that class right?
Join our real-time social learning platform and learn together with your friends!
 Bounty:
the world keeps moving fast and I'm stuck in a time lapse all I need is a minute
Bounty:
can I get so tips on how to start my journey into semi-realism art also on how to
Bounty:
the world keeps moving fast and I'm stuck in a time lapse all I need is a minute
Bounty:
can I get so tips on how to start my journey into semi-realism art also on how to
 Strawberryluna:
Read my poem. Im not for criticism its a poem I wrote after my breakup: Youu2019ll never understand the way you made me break, I hate that I still love you
Bounty:
first poem in a min- (tittle)? one moment i'm fine I smile till my face burns I laugh till I cant breath Then I cry I wonder where I went wrong I listen to
Strawberryluna:
Read my poem. Im not for criticism its a poem I wrote after my breakup: Youu2019ll never understand the way you made me break, I hate that I still love you
Bounty:
first poem in a min- (tittle)? one moment i'm fine I smile till my face burns I laugh till I cant breath Then I cry I wonder where I went wrong I listen to
 Twaylor:
3d printing a glider (for 150 pound 5'8 person - prolly should make it for up to
Twaylor:
3d printing a glider (for 150 pound 5'8 person - prolly should make it for up to
 cullenn:
pitter patter sound of rain gently tapping my window tonight. calming, soothing, right? not for me.
cullenn:
pitter patter sound of rain gently tapping my window tonight. calming, soothing, right? not for me.

 Arriyanalol:
DON'T BUY TICKETS TO SEAWORLD i watched a documentary on seaworld and its sad wha
Arriyanalol:
DON'T BUY TICKETS TO SEAWORLD i watched a documentary on seaworld and its sad wha
 natalieee:
who else wants a job in biology? I love biomedical science and want to work with
natalieee:
who else wants a job in biology? I love biomedical science and want to work with