 Ballery1:
Need some intuitive understanding or some graphs...
Ballery1:
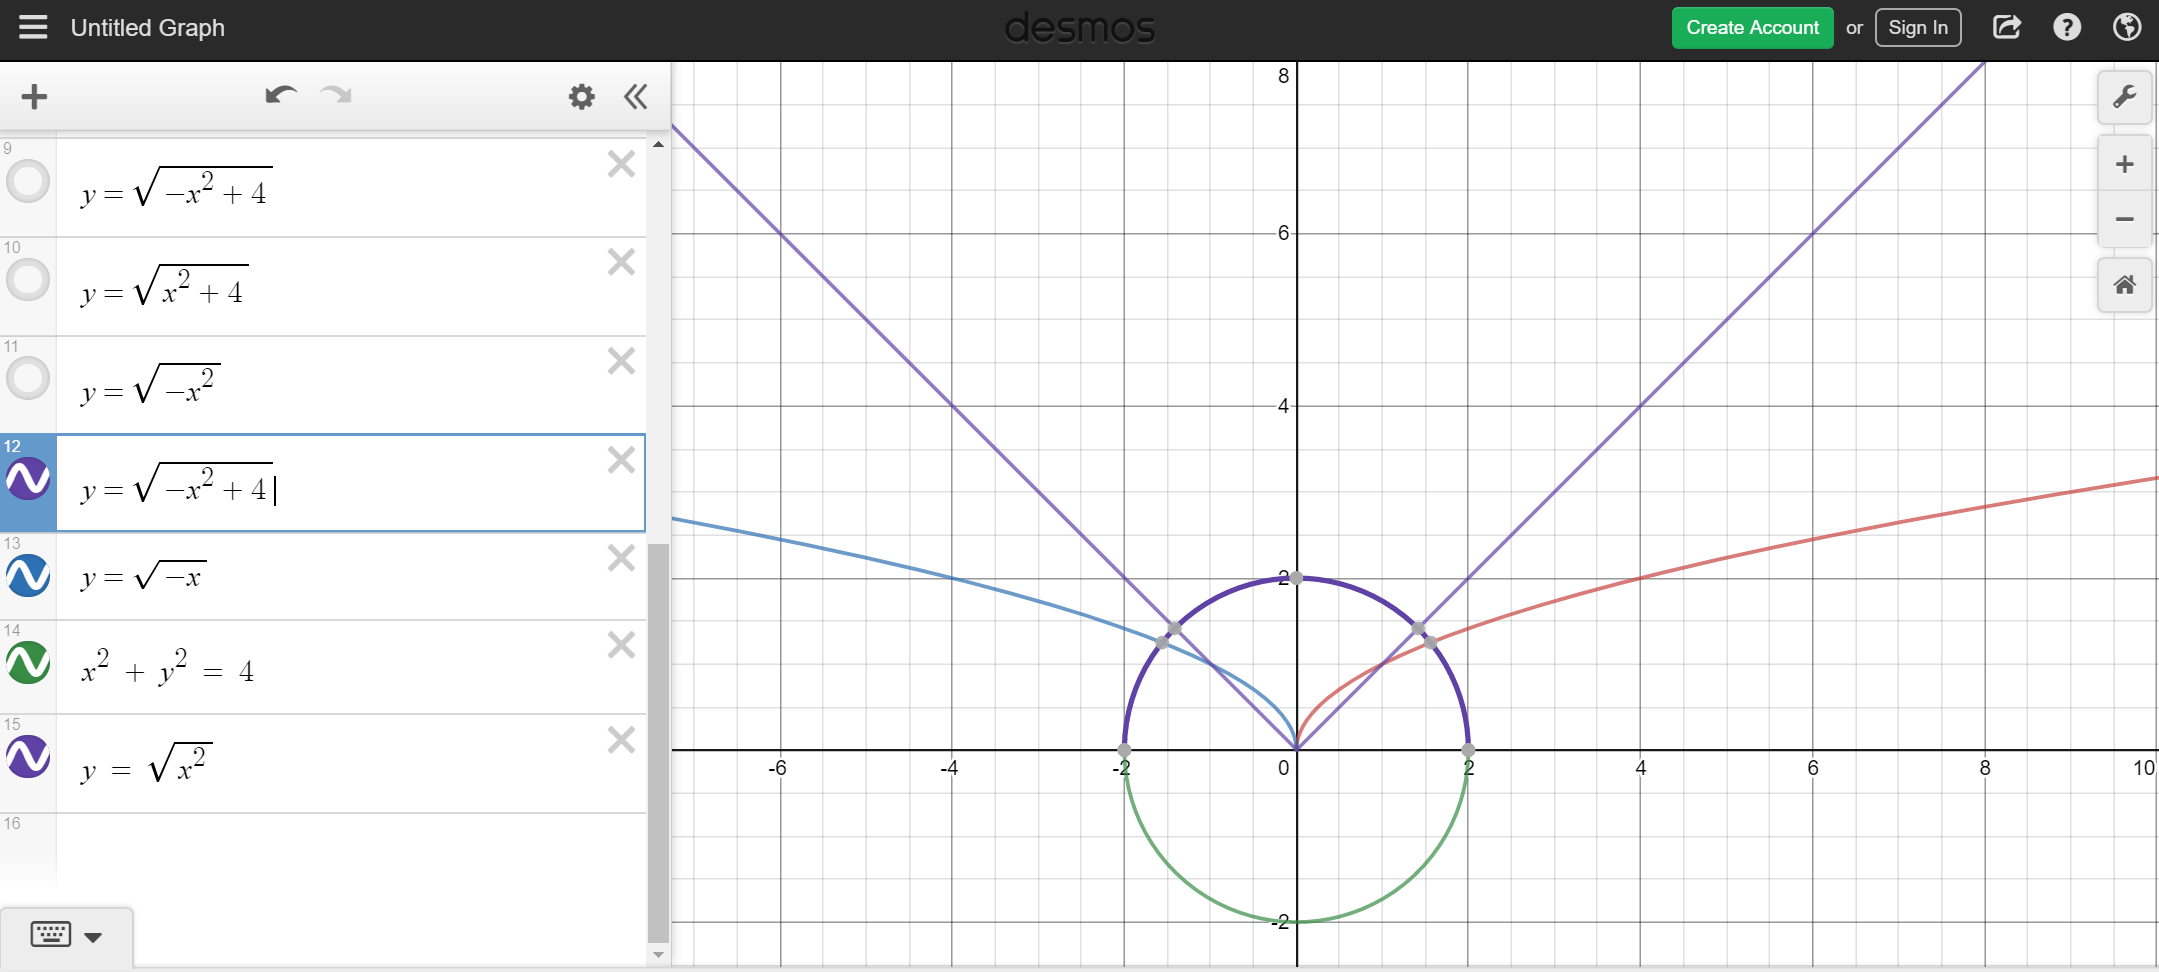
First i wanna know is that why’s \[Y = \sqrt{-x^2+4}\] so similar to \[X^2+Y^2 = 4\] Second, how did a simple funcnction graph of \[Y = \sqrt{x} \] or \[Y = \sqrt{-x} \] turned into circular graph like \[Y = \sqrt{-x^2 +4}\] why’s that so similar to \[X^2 + y^2 = 4\]
Ballery1:
Also why’s the graph of \[Y = \sqrt{x^2}\]so distinctively different from the rest?
Ballery1:
Why’s ^^^^^^ so similar to absolute function graph?
 jhonyy9:
the first one Y=sqrt(−x2+4) square both sides and get y^2 = -x^2 +4 yes ? so similar to X2+Y2=4
jhonyy9:
and in the second step assume to both sides +x^2 and will get x^2 +y^2 = 4 do you understand ?
Ballery1:
Not really... don’t worry about it... i’m typing out the stuff for my teachers to look at. I prefer them to help me understand :) hope u dont mind :)
Ballery1:
Also i need to know why’s the behavoir of root function graphs are so unpredictable...in a way. It’s not just a matter of simple *transformation of graph(s)* type scenario... like why’s the graph of \[Y = \sqrt{-x} \] reflected on to the second quadrant? Shouldn’t it be reflected down in the 4th quadrant like \[Y = x^2, y = -x^2\] do
Ballery1:
|dw:1560692806601:dw|
Ballery1:
|dw:1560692874353:dw|
Ballery1:
|dw:1560692952396:dw|
Ballery1:
|dw:1560693053337:dw|
 Hero:
Hero:
What you're asking about is covered in transformations of functions. And if what you graph is coming up blank, it means you need to either zoom in or out.
Hero:
But you won't be able to graph anything on that old eighties Casio
Hero:
So for now, use Geogebra
Ballery1:
Bro, i’m Literally on Desmos and i get nothing when i try to graph that function... i’ve Even zoomed in and out...
Hero:
It doesn't graph because you're trying to graph the square root of a negative number.
Hero:
The square root of a negative number is imaginary
Ballery1:
The thing is that ...i was writing notes on how the original graph of \[Y = \sqrt{-x^2 +4}\] is transformed from its parent function and by the time i got to \[\sqrt{-x^2}\] part, errthing blanked out on me..
Hero:
\(y = \sqrt{-x^2}\) is always imaginary, so it graphs no points, but \(y = \sqrt{-x^2+4}\) will graph a few points. Enough to create a semi-circle.
Ballery1:
And why’s that so similar to x^2 +y^2 = 4
Hero:
Because \(x^2 + y^2 = 4\) is the graph of a circle
Ballery1:
Because when i look at \[Y = \sqrt{-x+4}\] i take that as a graph that is shifted 4 units to the left...but it doesn’t ;-;
Hero:
If you have \(x^2 + y^2 = 4\) then subtract \(x^2\) from both sides and square root both sides you get \(y = \sqrt{4 - x^2}\) which is the top half of the circle. \(y = -\sqrt{4 - x^2}\) is the bottom half of the circle.
Ballery1:
Wait let me draw that... one sec
Ballery1:
|dw:1560695361162:dw|
Hero:
You should review Transformations of Functions in IXL
Ballery1:
I have function transformations coming up on page 4 i believe..
Hero:
To learn the difference between \(y = -\sqrt{x}\) and \(y = \sqrt{-x}\)
Hero:
Those are two different transformations of \(y = \sqrt{x}\)
Hero:
One reflects \(\sqrt{x}\) over the vertical axis, the other reflects \(\sqrt{x}\) over the horizontal axis.
Ballery1:
One should reflect the parent function in the 2nd quadrant and the other flips it in the 4th?
Ballery1:
Okie dokie...
Ballery1:
Soo how do i figure out the domain and range of function \[Y= \sqrt{-x^2+4}\]
Hero:
Well, one way to figure it out is by graphing. The other way is by attempting to graph points. We know that the square root of a negative number is imaginary so the domain must be \(-4 \le x \le 4\).
Ballery1:
Plz make it easy
Hero:
Take the values of the domain and plug them in and see what you get for \(y\) values.
Hero:
From there, you can determine the range.
Ballery1:
Way way way way way.. i need to show you something...let me draw.
Hero:
Did you install geogebra yet?
Hero:
Sorry the domain is \(-2 \le x \le 2\) my bad
Ballery1:
|dw:1560695909614:dw|
Ballery1:
I have symbolab
Ballery1:
Yuhh, the domain should be between -2 and 2
Hero:
I know about symbolab. That's good but geogebra is the best of the best of graphing utilities.
Ballery1:
Hopefully it’s free. Or else i might haff to getta pirated copy
Hero:
It's definitely free.
Ballery1:
Swee :)
Ballery1:
Wait, let me finish off this question...brb And THANKS :)
Ballery1:
|dw:1560696906723:dw|
Ballery1:
Thanks everyone:)
Join our real-time social learning platform and learn together with your friends!
 Bounty:
the world keeps moving fast and I'm stuck in a time lapse all I need is a minute
Bounty:
can I get so tips on how to start my journey into semi-realism art also on how to
Bounty:
the world keeps moving fast and I'm stuck in a time lapse all I need is a minute
Bounty:
can I get so tips on how to start my journey into semi-realism art also on how to
 Strawberryluna:
Read my poem. Im not for criticism its a poem I wrote after my breakup: Youu2019ll never understand the way you made me break, I hate that I still love you
Bounty:
first poem in a min- (tittle)? one moment i'm fine I smile till my face burns I laugh till I cant breath Then I cry I wonder where I went wrong I listen to
Strawberryluna:
Read my poem. Im not for criticism its a poem I wrote after my breakup: Youu2019ll never understand the way you made me break, I hate that I still love you
Bounty:
first poem in a min- (tittle)? one moment i'm fine I smile till my face burns I laugh till I cant breath Then I cry I wonder where I went wrong I listen to
 Twaylor:
3d printing a glider (for 150 pound 5'8 person - prolly should make it for up to
Twaylor:
3d printing a glider (for 150 pound 5'8 person - prolly should make it for up to
 cullenn:
pitter patter sound of rain gently tapping my window tonight. calming, soothing, right? not for me.
cullenn:
pitter patter sound of rain gently tapping my window tonight. calming, soothing, right? not for me.

 Arriyanalol:
DON'T BUY TICKETS TO SEAWORLD i watched a documentary on seaworld and its sad wha
Arriyanalol:
DON'T BUY TICKETS TO SEAWORLD i watched a documentary on seaworld and its sad wha
 natalieee:
who else wants a job in biology? I love biomedical science and want to work with
natalieee:
who else wants a job in biology? I love biomedical science and want to work with