 zarkam21:
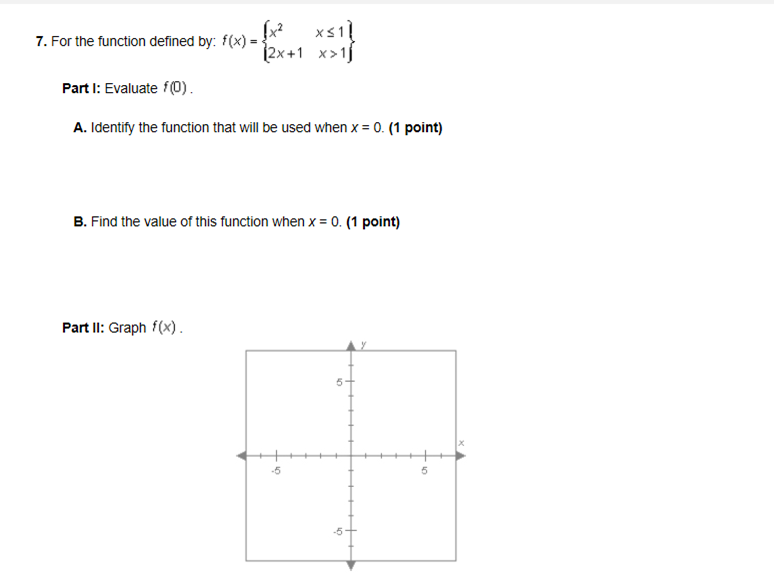
Help please
 Ultrilliam:
@563blackghost
zarkam21:
@Vocaloid
zarkam21:
@Vocaloid
 Vocaloid:
For piecewise fumctions you use the inequalities to determine which row of the function you use for the given x value
Vocaloid:
Do for x = 0 would this be the top row or the bottom row?
zarkam21:
top
Vocaloid:
Good so f(0) =?
zarkam21:
x^2+x<=1
Vocaloid:
There is no reason to add the functions together
zarkam21:
oh how would I join them
Vocaloid:
We have established that f(x) = x^2 for x = 0 So evaluate f(0)
zarkam21:
x^2
Vocaloid:
What does x^2 equal when x = 0
Vocaloid:
Replace x with 0 and evaluate x^2
Vocaloid:
Anyway I got to go, I can help you with the graphing after class if you're still free
zarkam21:
okay when you are back, we can finish this
Vocaloid:
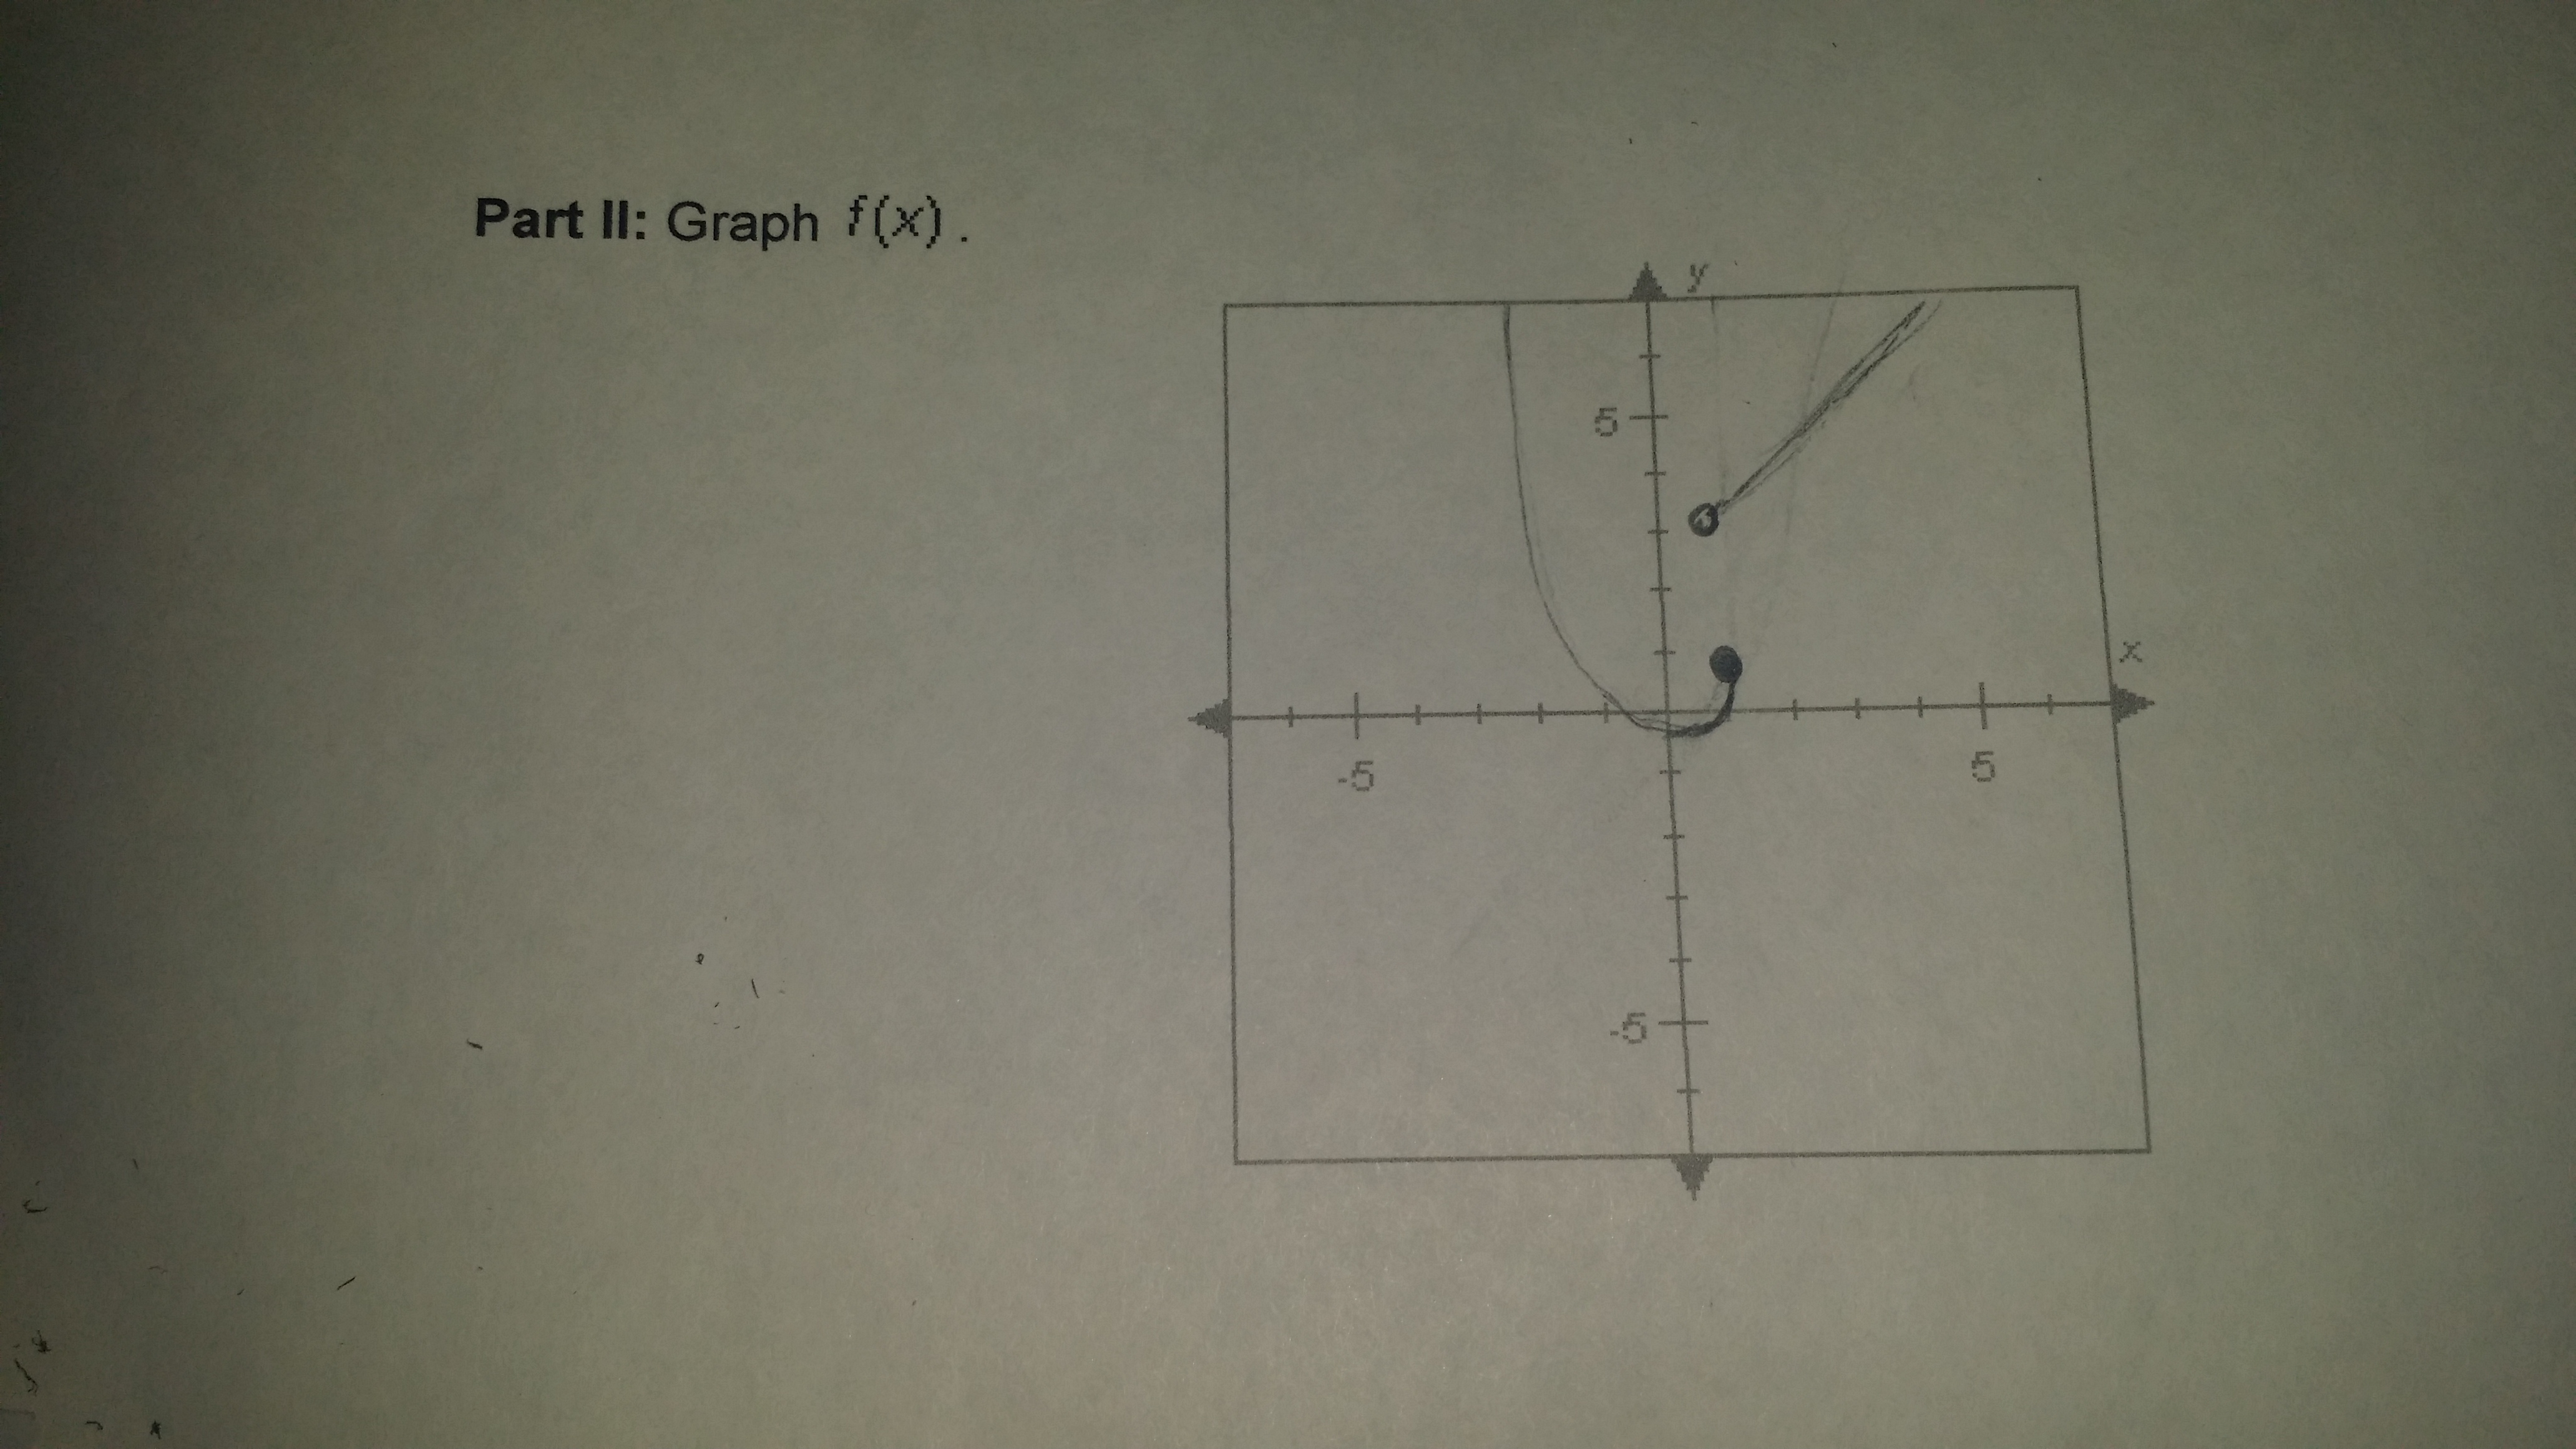
to graph the function you would just follow the instructions given in part II
Vocaloid:
for example, for IIA it asks you to graph the first function normally (as if it were a normal function not a piecewise function)
Vocaloid:
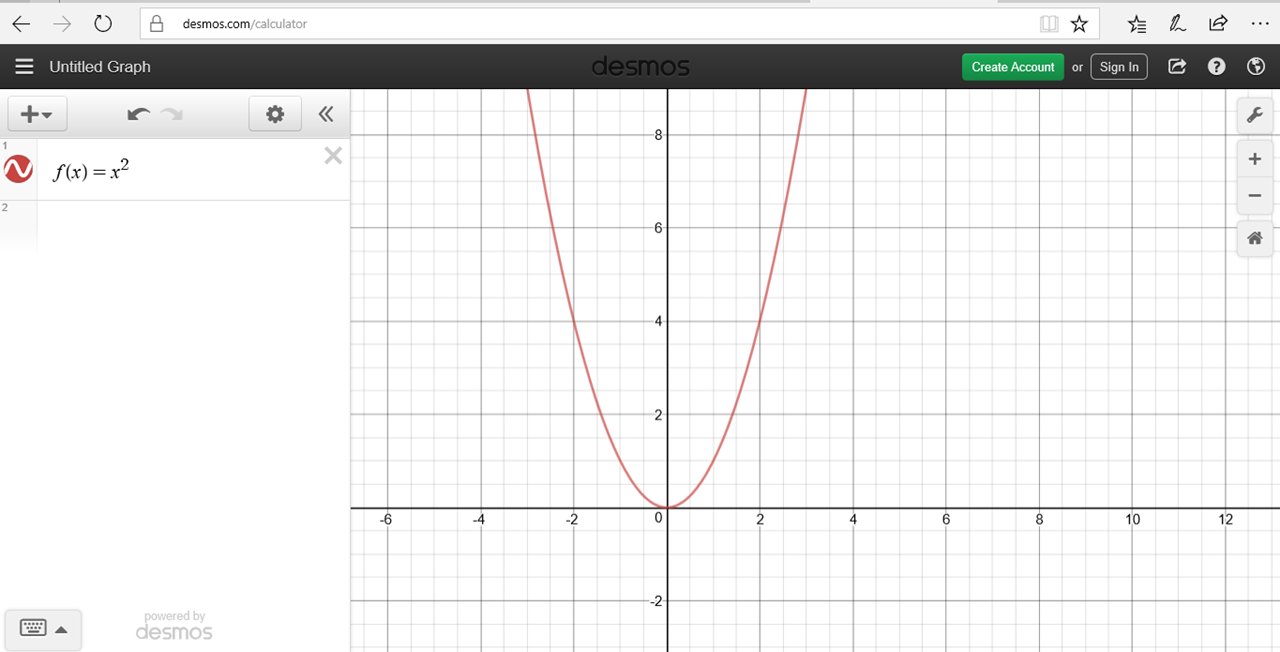
so graph f(x) = x^2
zarkam21:
okay for number 7 part a
zarkam21:
I would write f(x) = x^2 for x = 0
Vocaloid:
yes
zarkam21:
and then for part b
zarkam21:
I would write f(0)=0^2
zarkam21:
?
Vocaloid:
yes but make sure to evaluate what 0^2 is equal to
zarkam21:
0?
zarkam21:
so f(0)=0
Vocaloid:
yes
zarkam21:
okay now for the graphing part
zarkam21:
just graph f(x) = x^2
Vocaloid:
yes for part IIA
 Vocaloid:
good.
zarkam21:
Now for IIB I would graph f(x)=x<=1
Vocaloid:
you would graph f(x) = 2x + 1
Vocaloid:
since that's the function for the second row
zarkam21:
okay did that.
zarkam21:
now for IIc
Vocaloid:
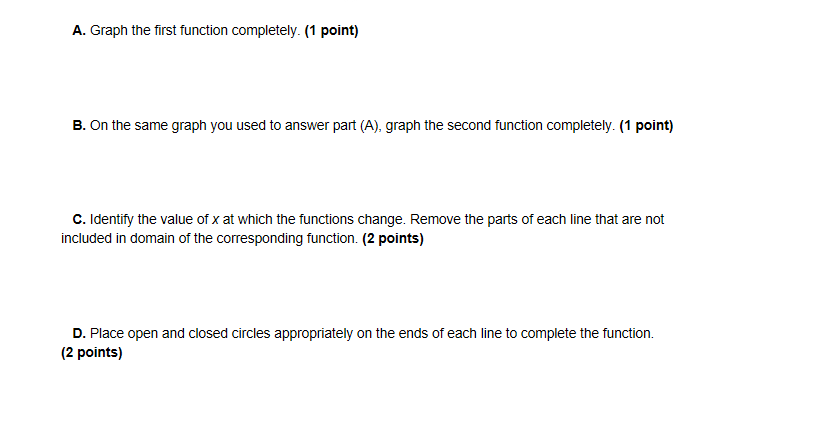
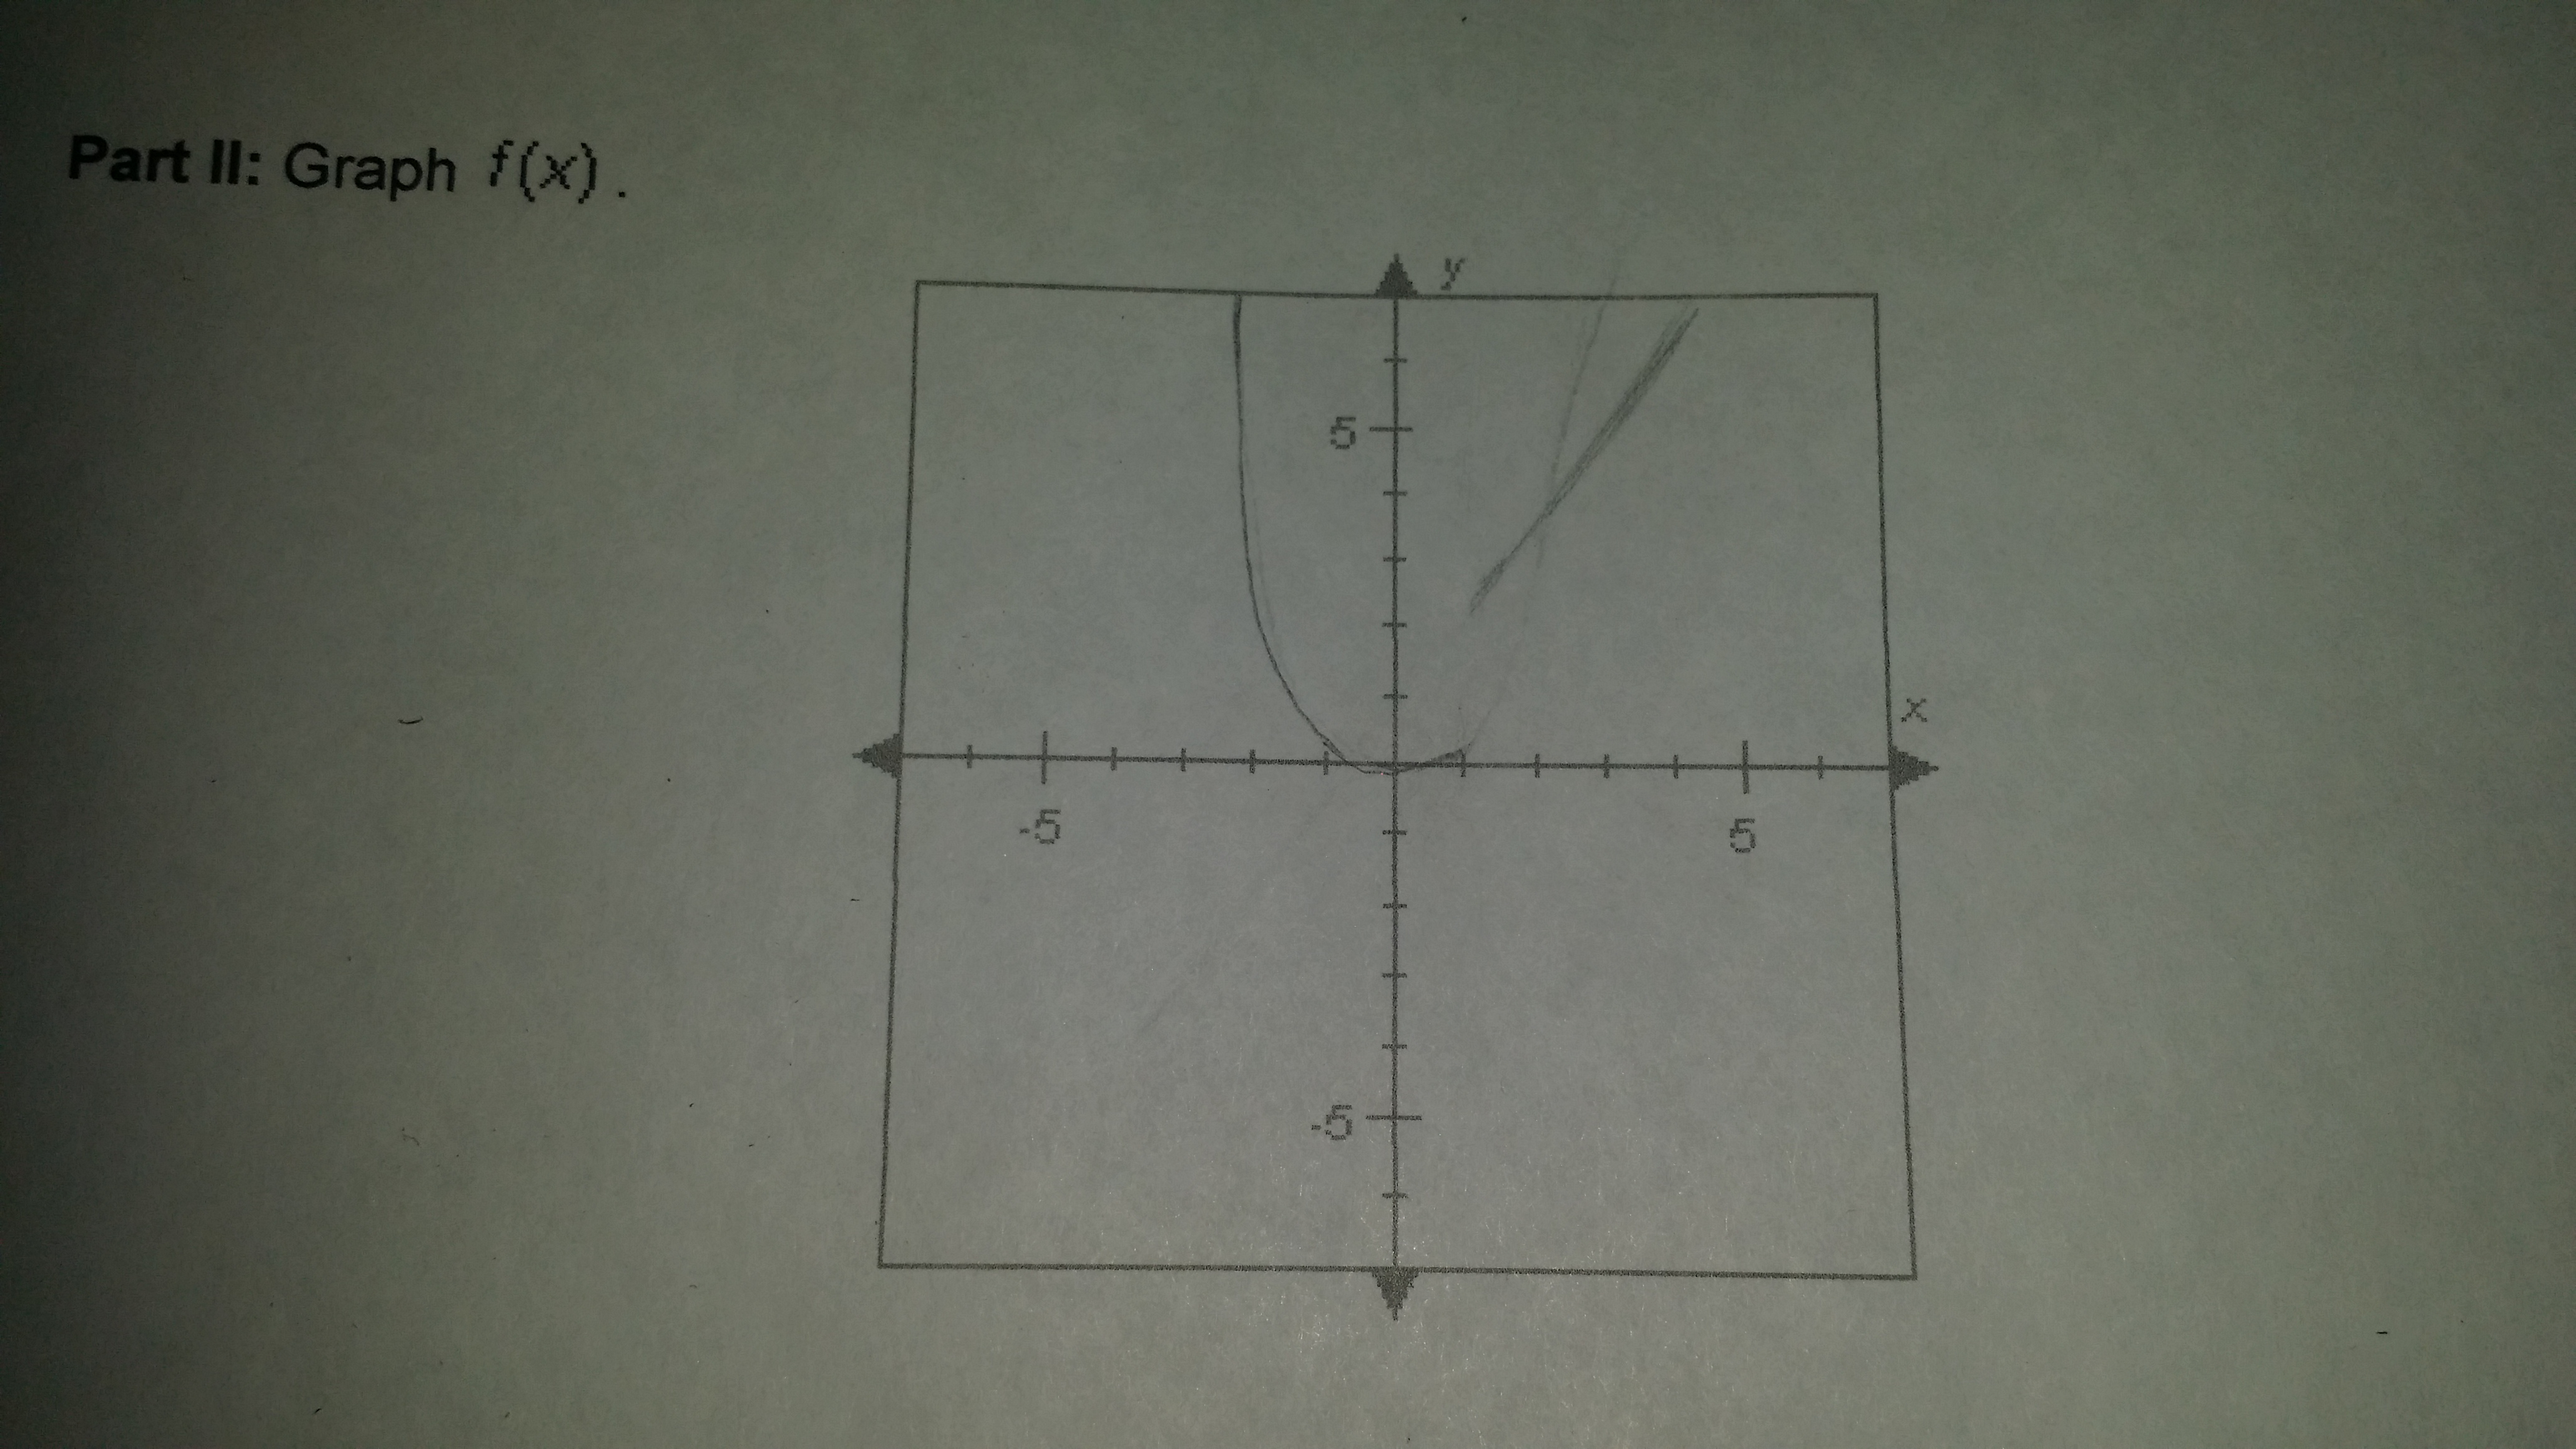
now you just go back to your graph and erase the parts that aren't included on the domain
Vocaloid:
for example, for f(x) = x^2 for x<=1 you would just erase the graph where x is greater than 1
 zarkam21:
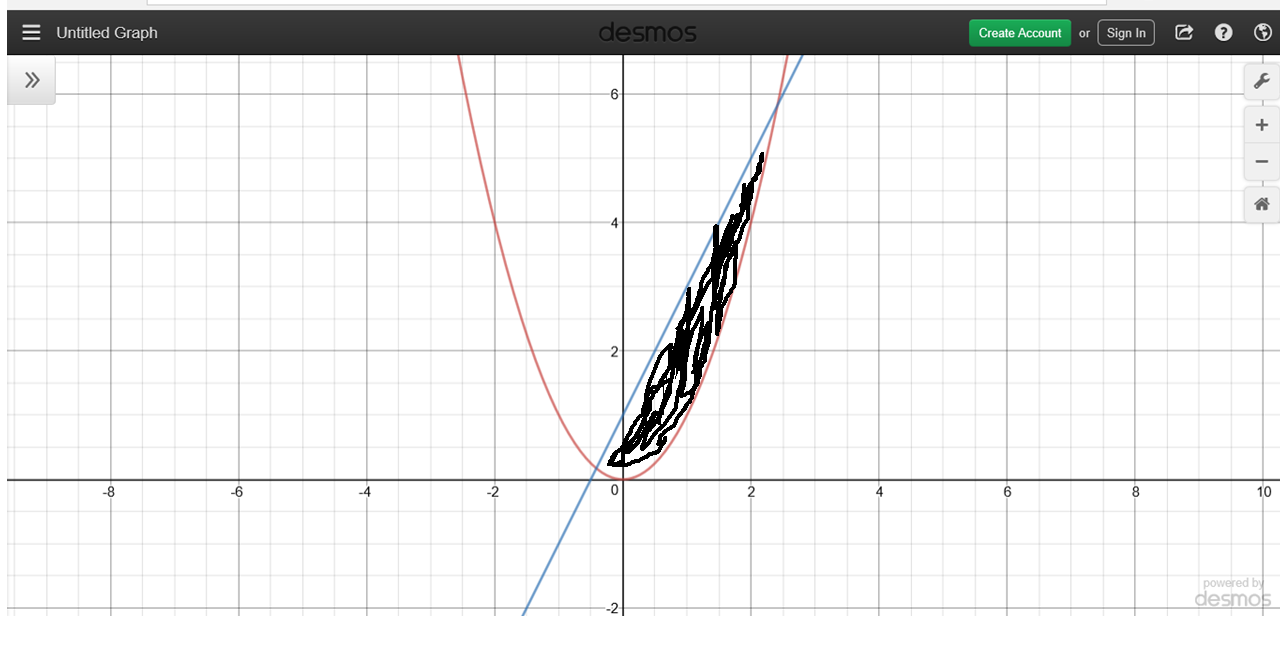
so erase everything except for the black shaded region
Vocaloid:
imagine an imaginary line at x = 1 and erase the graph of x^2 on the right of the line
Vocaloid:
|dw:1510158645471:dw|
Vocaloid:
|dw:1510158652567:dw|
Vocaloid:
|dw:1510158666325:dw|
zarkam21:
okay
zarkam21:
did that
Vocaloid:
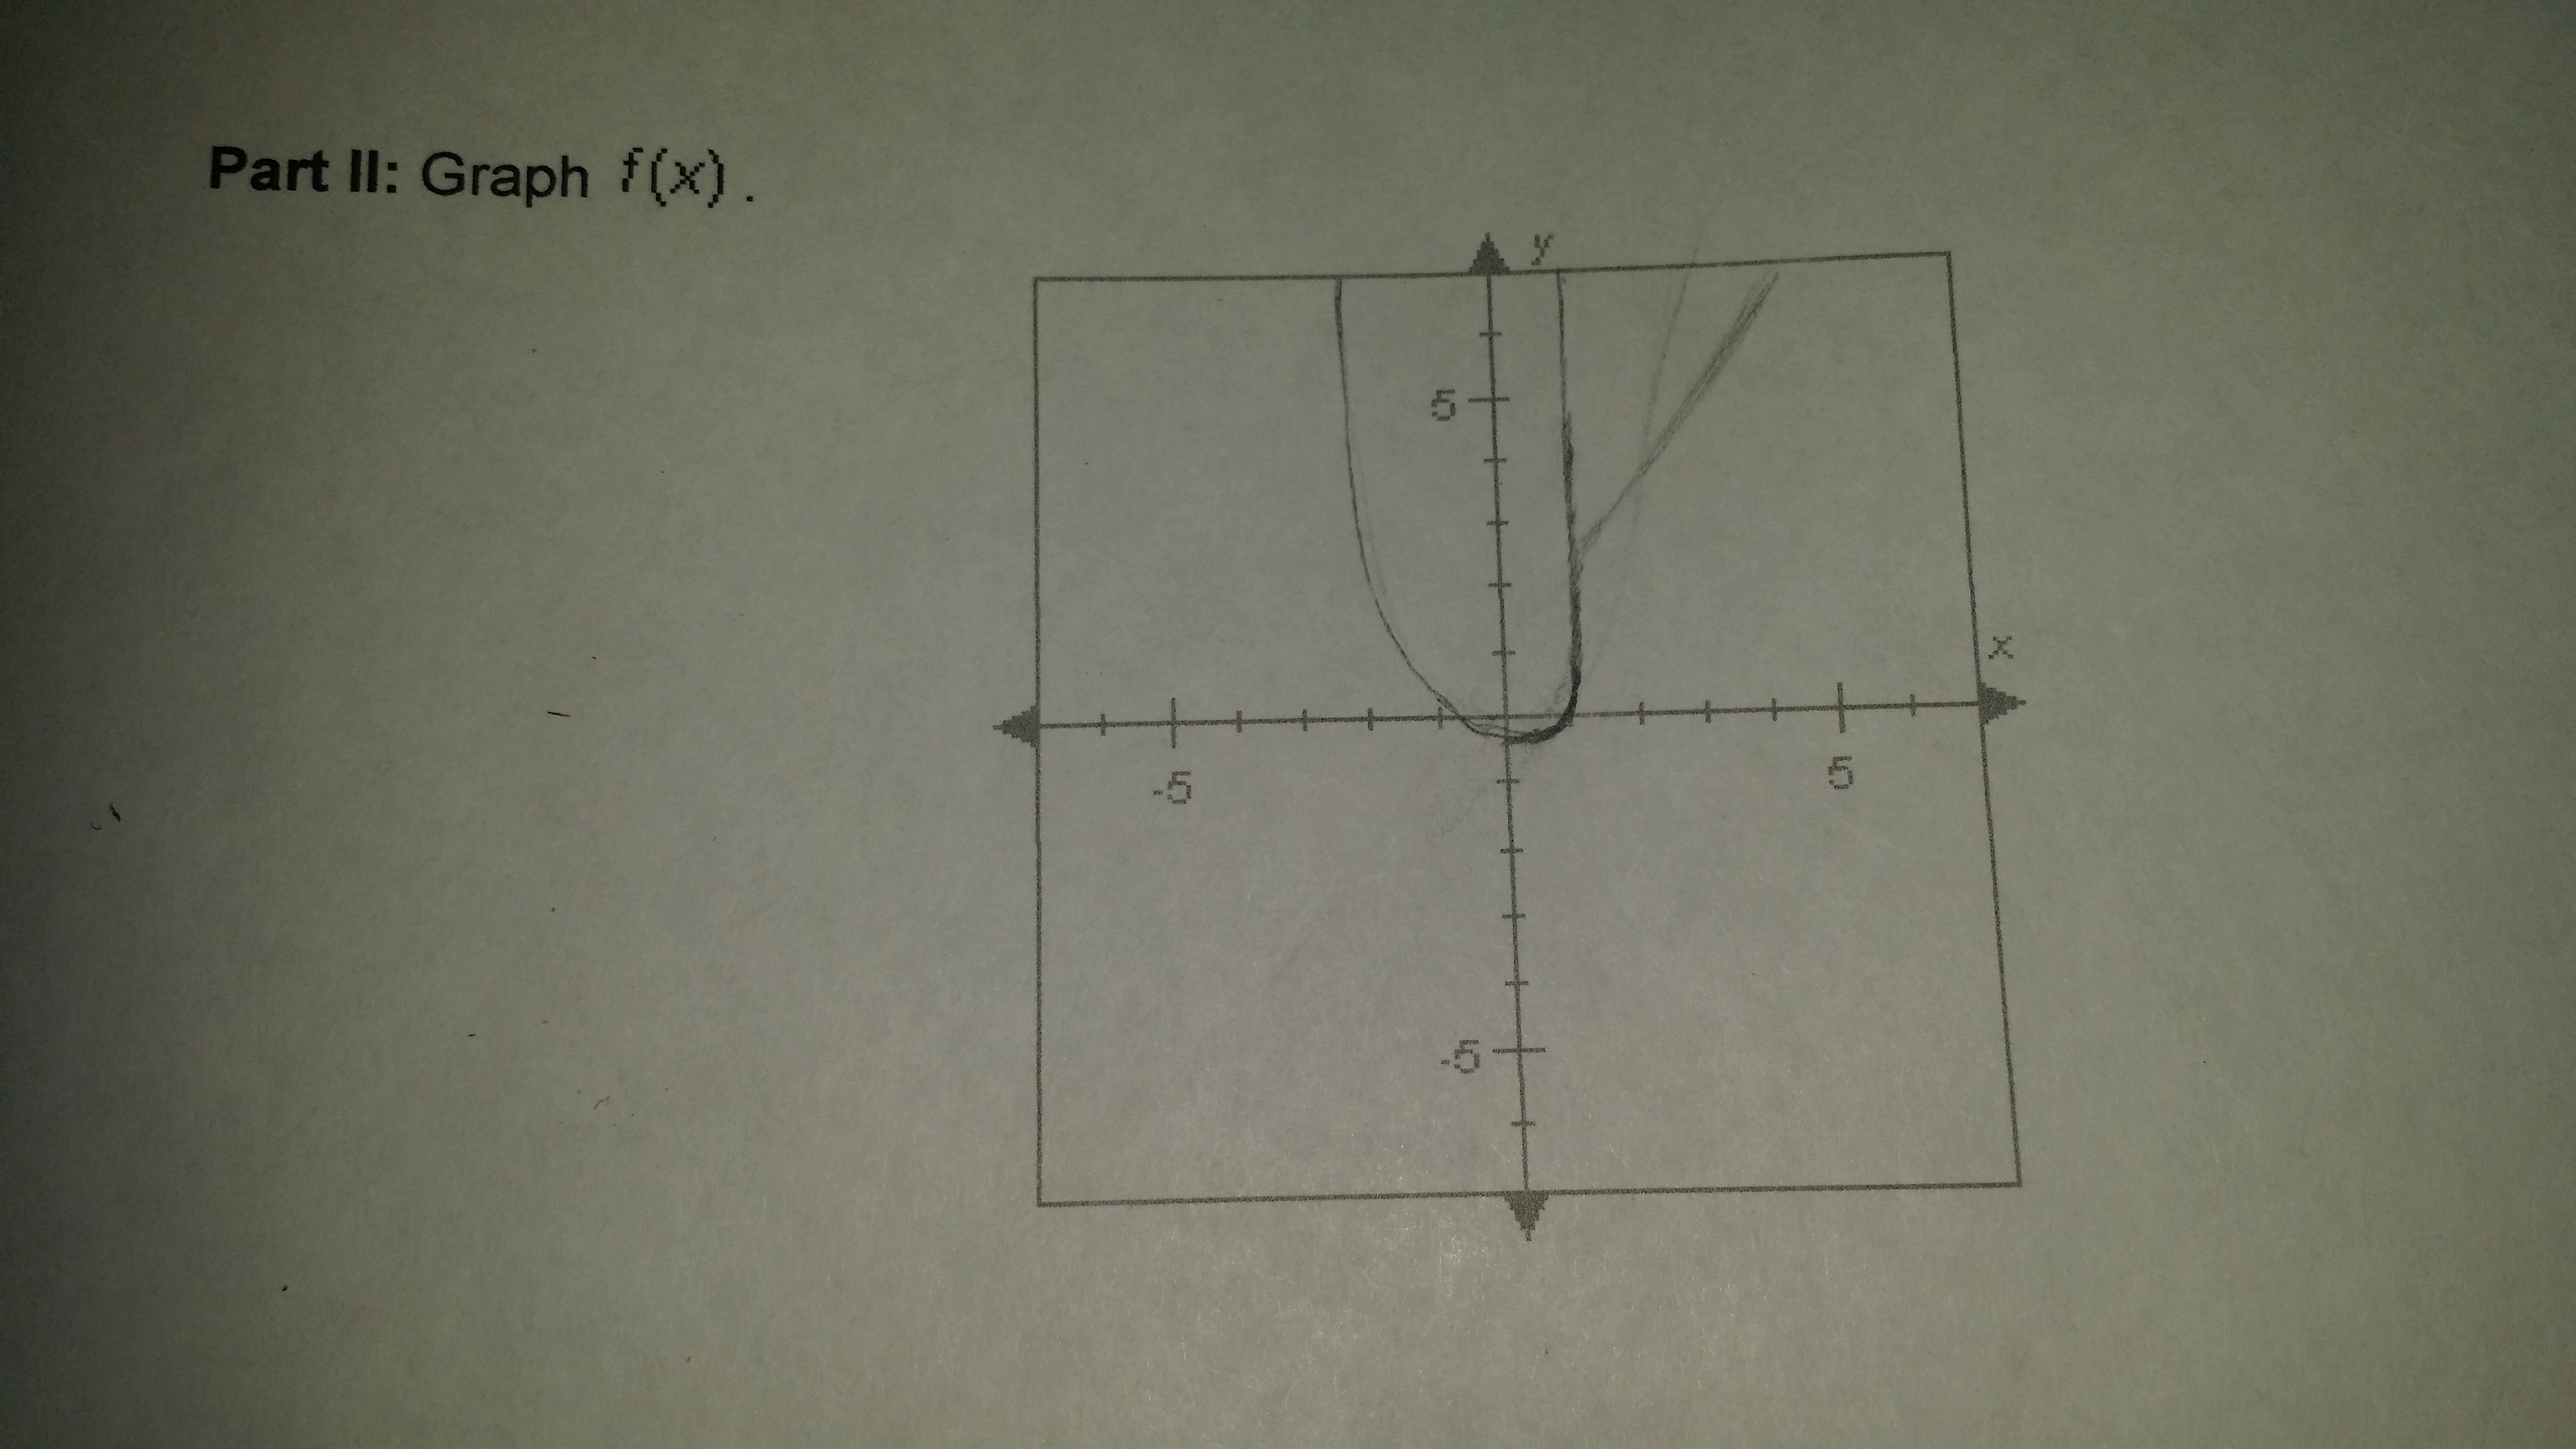
now for 2x + 1 erase the graph where x < 1
 Vocaloid:
you want to erase the graph where x is ~~less~~ than 1
zarkam21:
oh okay so the opposite
Vocaloid:
yes
 Vocaloid:
you have the right idea but check the values of your graph
Vocaloid:
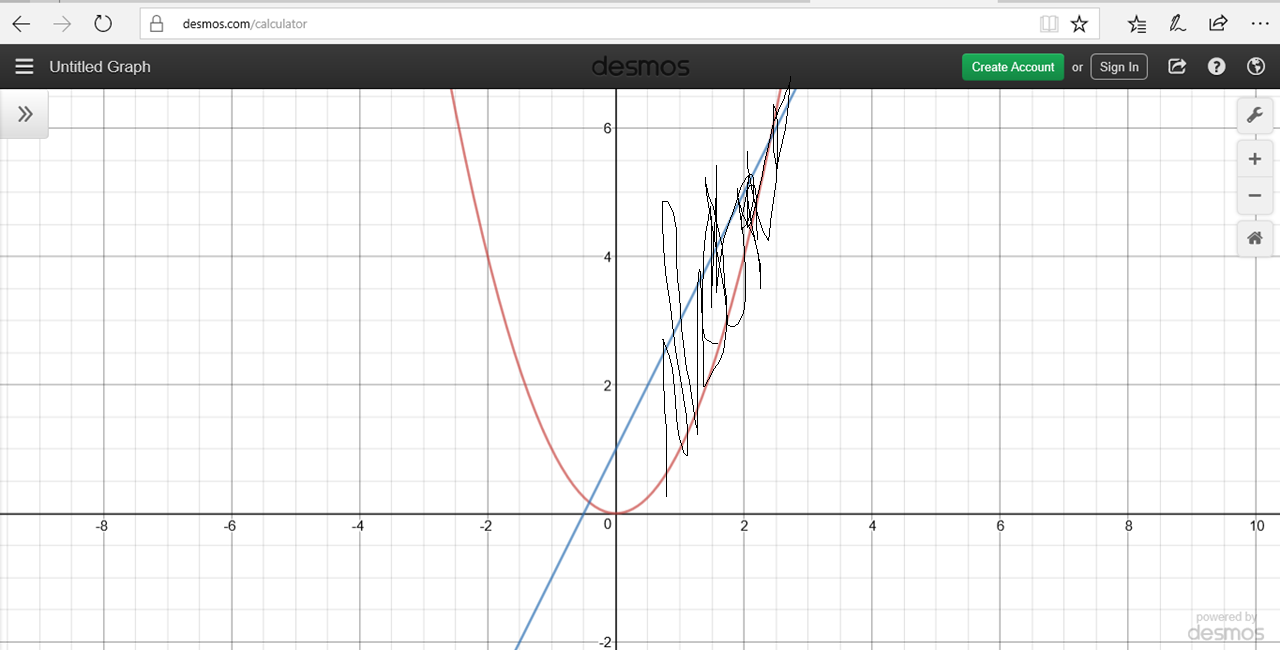
for example, when x = 1 x^2 = 1 so the x^2 graph should have a point at (1,1)
Vocaloid:
and when x = 1, 2x+1 = 3 so the graph of 2x+1 should have a point at (1,3)
 Vocaloid:
|dw:1510159235424:dw|
Vocaloid:
|dw:1510159243443:dw|
Vocaloid:
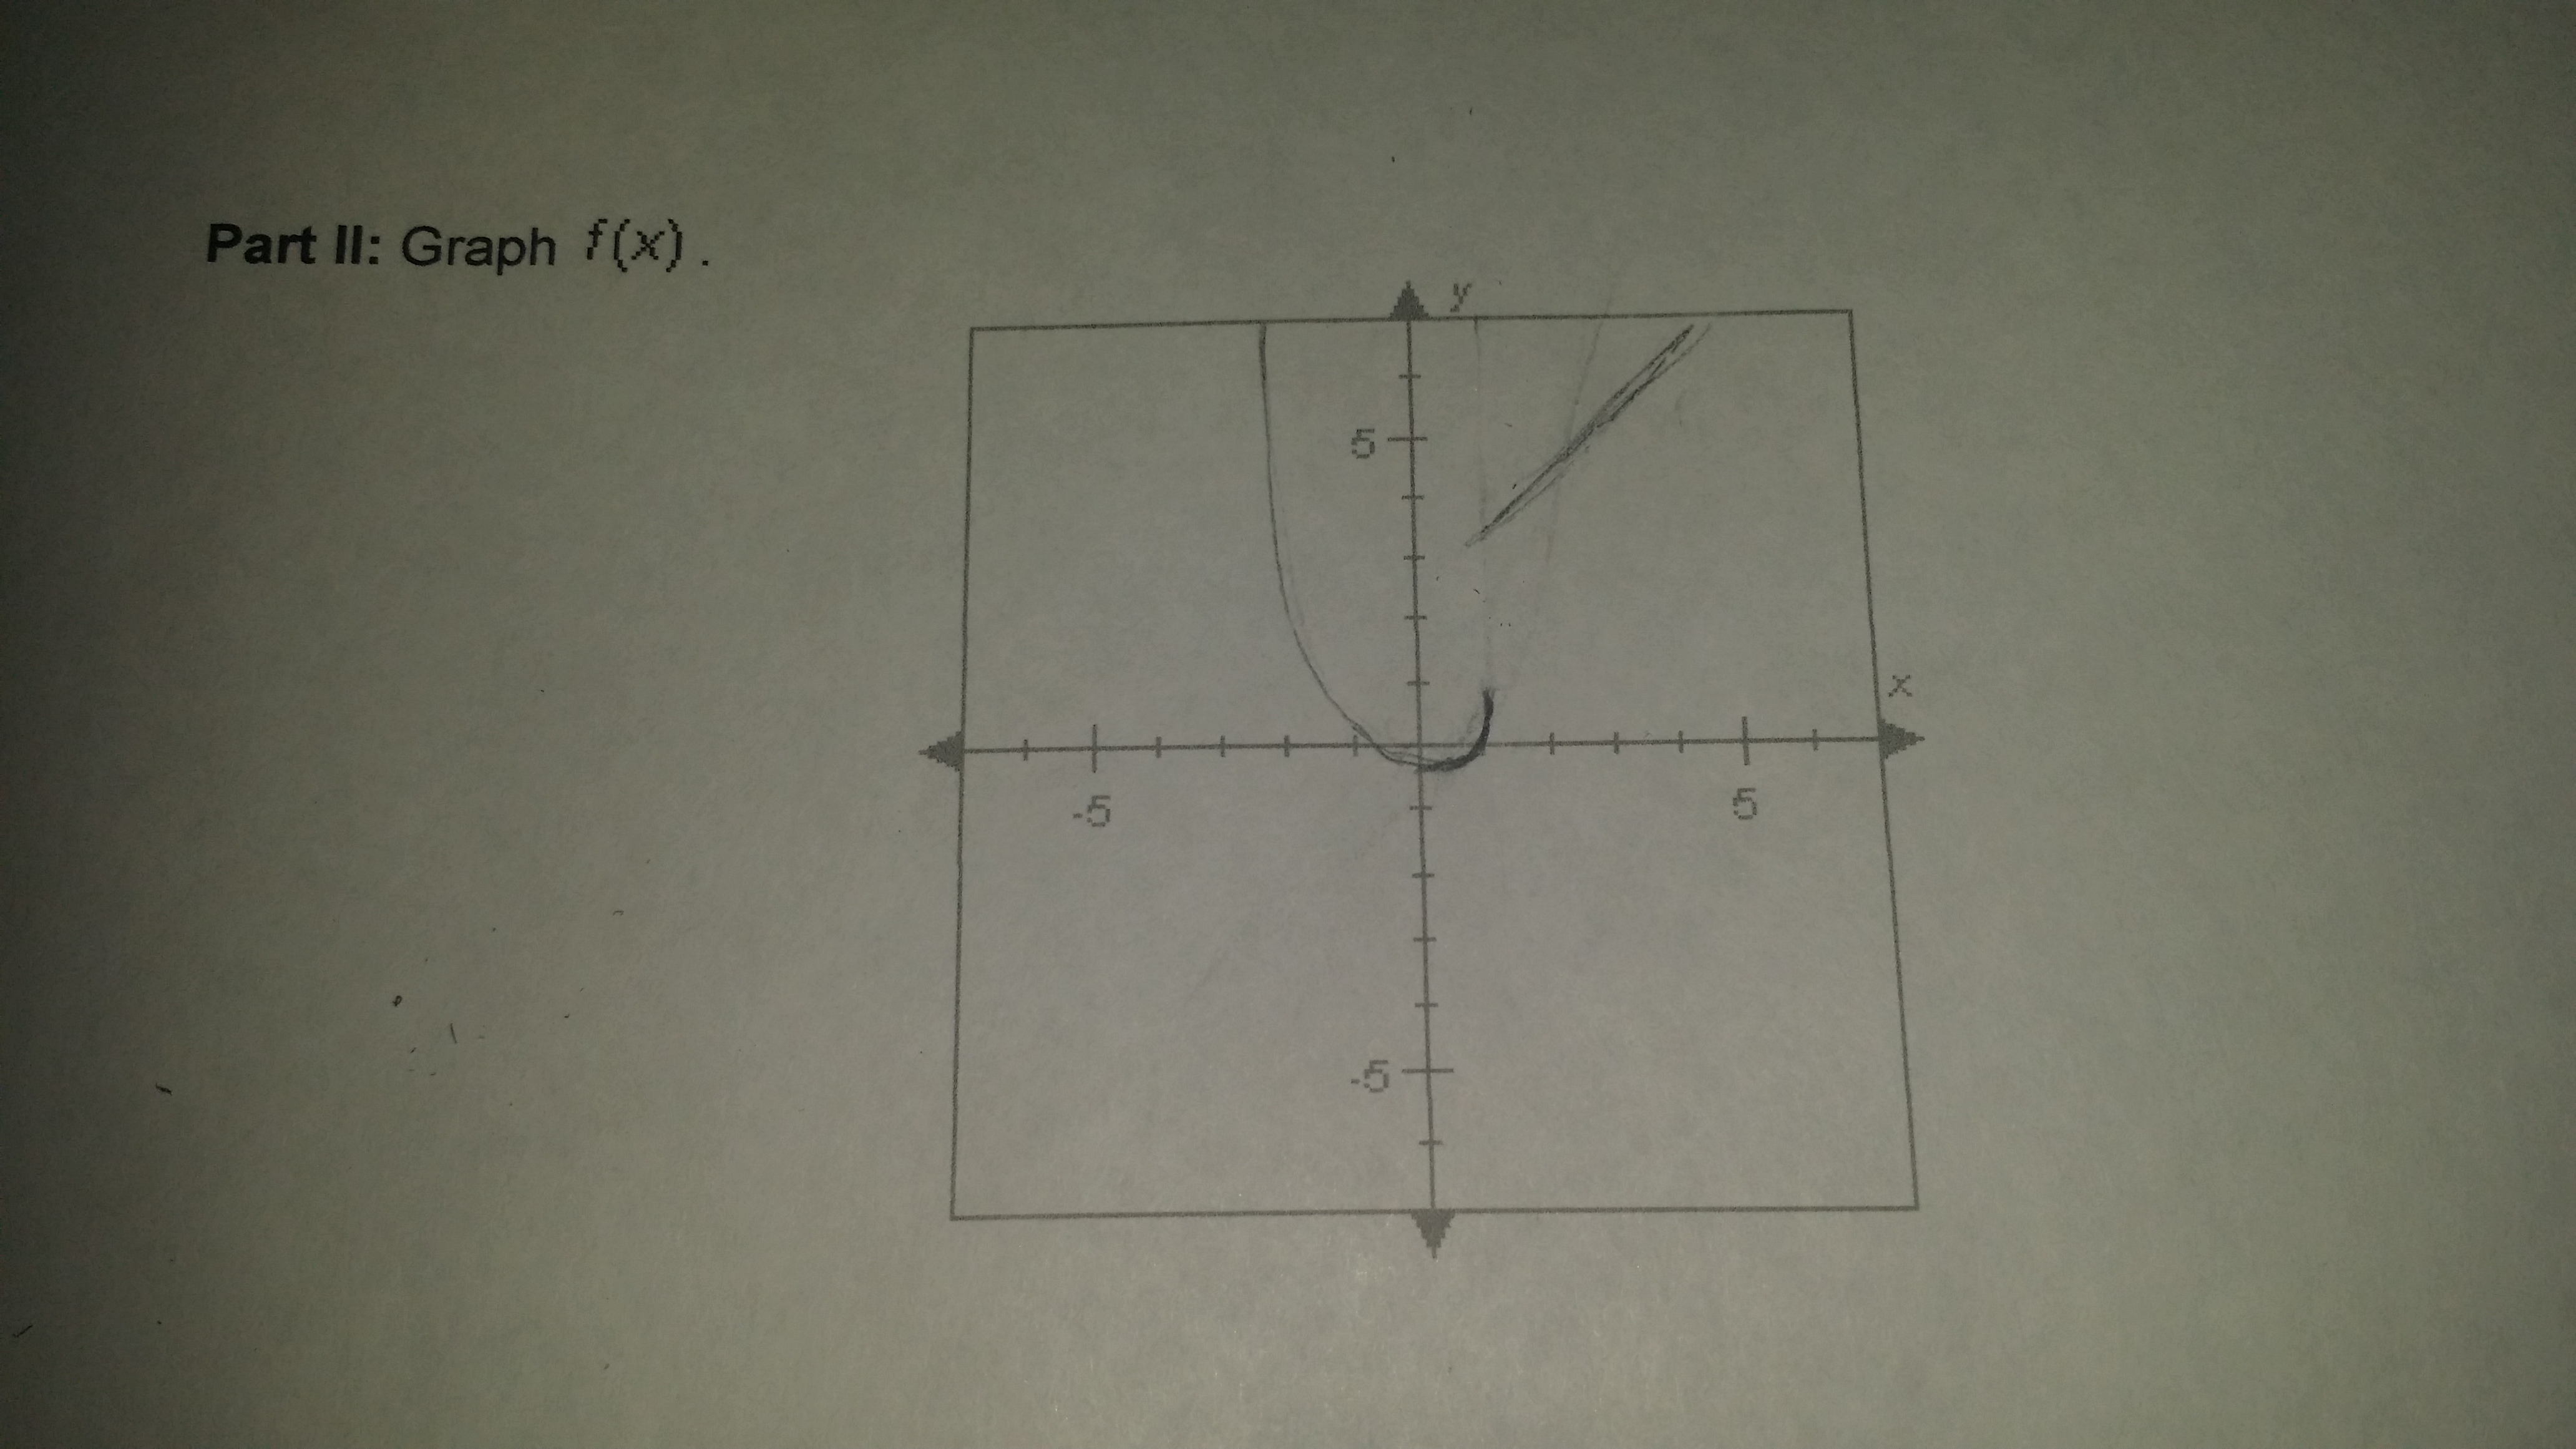
the parabola stops at (1,1) and the straight line starts at (1,3)
 Vocaloid:
good, that's it for part IIb
zarkam21:
you mean c
zarkam21:
;p
Vocaloid:
yeah
zarkam21:
okay next, the last part
zarkam21:
is to place open and closed circles
Vocaloid:
anyway for part D, any inequality with > or < gets an open circle and >= and <= get closed circles
Vocaloid:
so the parabola gets a closed circle at (1,1) and the line gets an open circle at (1,3)
 Vocaloid:
good that's it
Join our real-time social learning platform and learn together with your friends!
 Twaylor:
Time flies doesn't it? I tried to not be the second squeaky wheel of the household and ended up hurting myself and others severely.
Twaylor:
Time flies doesn't it? I tried to not be the second squeaky wheel of the household and ended up hurting myself and others severely.
 clllaaaaaire:
any tips? the quality isn't the best because I am using this site on my computer
clllaaaaaire:
any tips? the quality isn't the best because I am using this site on my computer
 Midnight97:
Kinda a roleplay story between me and my friend enjoy... Part one Forgive me for all the screenshots.
Midnight97:
Kinda a roleplay story between me and my friend enjoy... Part one Forgive me for all the screenshots.
 StevenisGhost:
what type of song should I make next, and will y'all go check out my new song on
Midnight97:
My drawing sure changed over the years look at these two pictures from 2024 to no
StevenisGhost:
what type of song should I make next, and will y'all go check out my new song on
Midnight97:
My drawing sure changed over the years look at these two pictures from 2024 to no
 EdwinJsHispanic:
"poem" love is So Beautiful to have. But it's so hard to have. At this point I don't know whether its worth the wait Or if it's just millions of miles to re
EdwinJsHispanic:
"poem" love is So Beautiful to have. But it's so hard to have. At this point I don't know whether its worth the wait Or if it's just millions of miles to re
EdwinJsHispanic:
"poem" love is So Beautiful to have. But it's so hard to have. At this point I don't know whether its worth the wait Or if it's just millions of miles to re
EdwinJsHispanic:
"poem" love is So Beautiful to have. But it's so hard to have. At this point I don't know whether its worth the wait Or if it's just millions of miles to re
 Breathless:
I don't know if this would be considered art, but its close enough I believe, Any
Breathless:
I don't know if this would be considered art, but its close enough I believe, Any