 Confusinated:
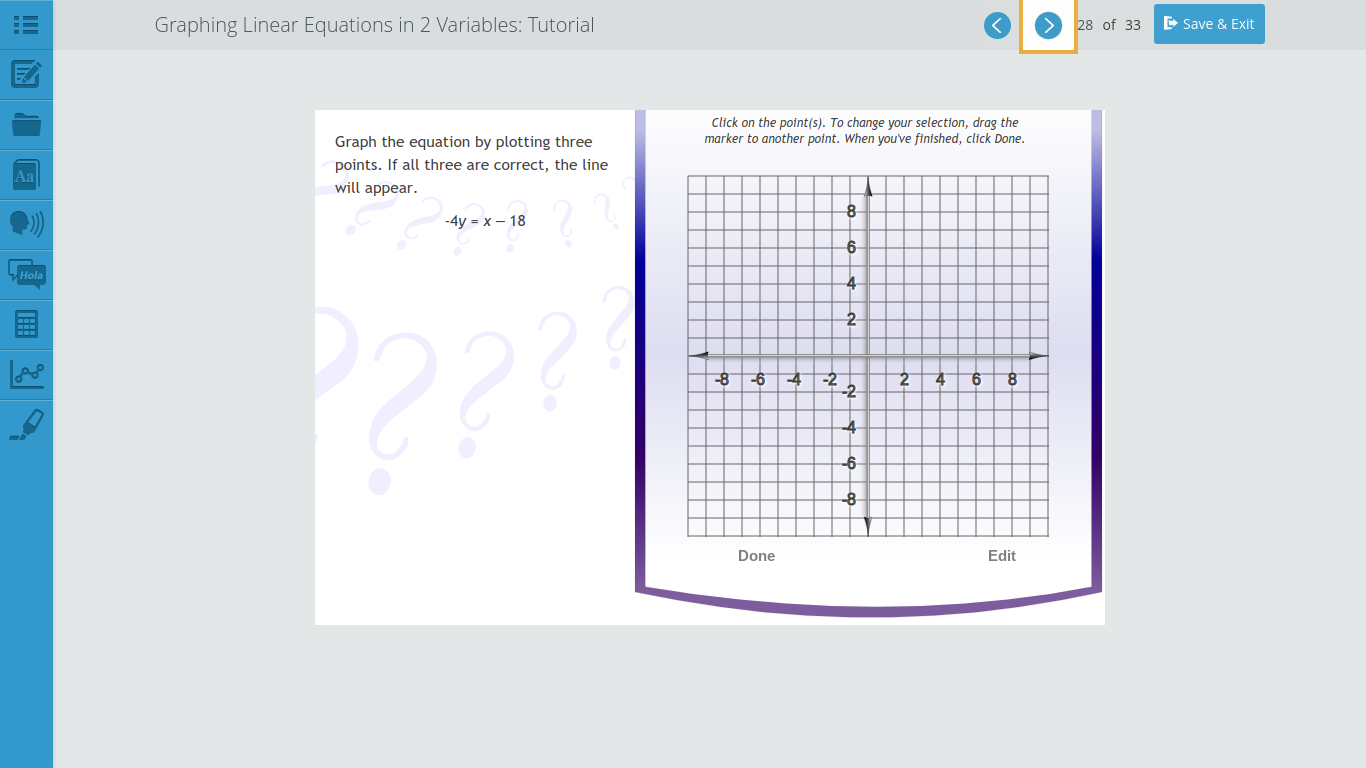
Graphing Linear Equations in 2 Variables
 Confusinated:
@JustSaiyan
Confusinated:
@Elsa213
Confusinated:
@Jason64
 Angle:
Let's try plugging in x = 4 into the given equation what would you get for \(y\)?
Angle:
oh my bad, I mean to say plug in x = 2 that would be easier
Confusinated:
actually angle i have no idea how to do this at all so yea my teacher just gave it to me
Angle:
ok, no problem here's an easy example of what I mean by "plug in" say we have the equation \(y = 2x\) this is basically "I double whatever you give me" so if you give me \(2\) (for x), I give you \(4\) (as y) essentially, when you give me "2", plugging in looks like \(y = 2(2) = 4\)
Confusinated:
oh it make a little more sense but i am still confussed
Angle:
So when we plug in \(x = 2\) into the given equation \(-4y = x -18\) we stick the \(2\) in like this: \(-4y = (2) - 18\) and we can "solve" for y like this \(-4y = -16\) (then divide both sides by negative 4) and get \(y = 4\)
Confusinated:
aww okay
Angle:
so one of the points you can graph is: when x=2 you have y=4 you may also see this in class as (x, y) = (2, 4) do you know how to graph coordinates? :)
Confusinated:
kind of
Confusinated:
well i got the answer thank you very much
Angle:
no problem, I'm glad I could help if you need any more explaining, feel free to ask :)
Confusinated:
okay thank you
Join our real-time social learning platform and learn together with your friends!
 Bounty:
the world keeps moving fast and I'm stuck in a time lapse all I need is a minute
Bounty:
can I get so tips on how to start my journey into semi-realism art also on how to
Bounty:
the world keeps moving fast and I'm stuck in a time lapse all I need is a minute
Bounty:
can I get so tips on how to start my journey into semi-realism art also on how to
 Strawberryluna:
Read my poem. Im not for criticism its a poem I wrote after my breakup: Youu2019ll never understand the way you made me break, I hate that I still love you
Bounty:
first poem in a min- (tittle)? one moment i'm fine I smile till my face burns I laugh till I cant breath Then I cry I wonder where I went wrong I listen to
Strawberryluna:
Read my poem. Im not for criticism its a poem I wrote after my breakup: Youu2019ll never understand the way you made me break, I hate that I still love you
Bounty:
first poem in a min- (tittle)? one moment i'm fine I smile till my face burns I laugh till I cant breath Then I cry I wonder where I went wrong I listen to
 Twaylor:
3d printing a glider (for 150 pound 5'8 person - prolly should make it for up to
Twaylor:
3d printing a glider (for 150 pound 5'8 person - prolly should make it for up to
 cullenn:
pitter patter sound of rain gently tapping my window tonight. calming, soothing, right? not for me.
cullenn:
pitter patter sound of rain gently tapping my window tonight. calming, soothing, right? not for me.

 Arriyanalol:
DON'T BUY TICKETS TO SEAWORLD i watched a documentary on seaworld and its sad wha
Arriyanalol:
DON'T BUY TICKETS TO SEAWORLD i watched a documentary on seaworld and its sad wha
 natalieee:
who else wants a job in biology? I love biomedical science and want to work with
natalieee:
who else wants a job in biology? I love biomedical science and want to work with