 AnimeGhoul8863:
• Create your own piecewise function with at least two functions. Explain, using complete sentences, the steps for graphing the function. Graph the function by hand or using a graphing software of your choice (remember to submit the graph).
 dude:
dude:
Okay this concept is not bad Create 2 equations One can be linear and the other quadratic
AnimeGhoul8863:
hmmmmmm 2 equations hmmmmmmmm
dude:
You can use like y=7x+1 and y=x^2
AnimeGhoul8863:
okie can i just use these ones u gave me or do you prefer me making one my self e.e
dude:
You can use mine but they came out of the top of my head XD
AnimeGhoul8863:
XD thats okie so once we have the 2 equations what next e.e
dude:
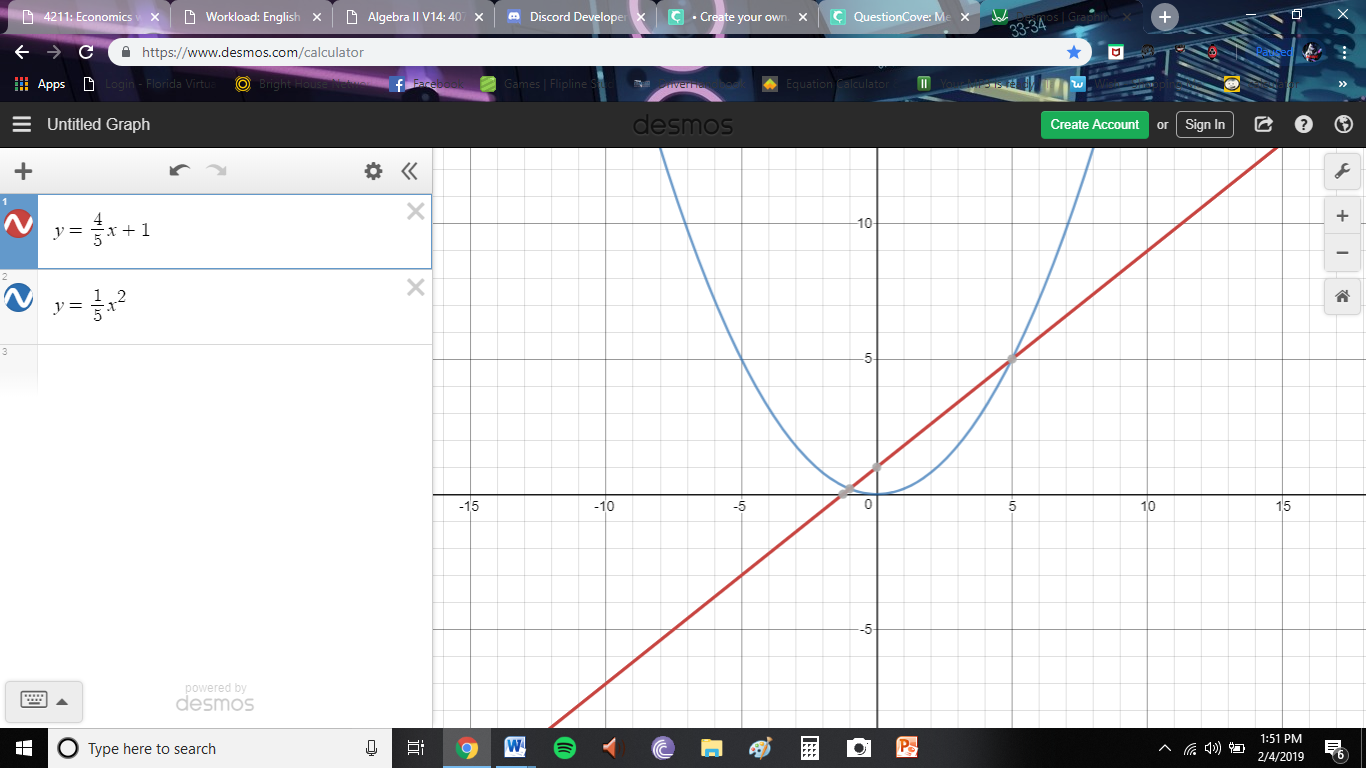
Okay just checked for an easier one to graph, let’s use y=4/5x+1 and y=1/5x^2
AnimeGhoul8863:
alright e.e
dude:
Okay let’s make the linear equation be from negative infinity to -1 The parabola would go from -1 to infinity
AnimeGhoul8863:
y=4/5x+1 this = -1? on my graph it equal 1 e.e like (0,1)
 dude:
dude:
Yep So piecewise defined means that they are limited at certain points https://www.desmos.com/calculator/aisvl8r4fr So in here I made it so that the line goes until -1 and the parabola starts at -1
AnimeGhoul8863:
Ok what next
dude:
I already did the last step, but we have to describe how to draw it Do you know how to describe it? or do you need help?
AnimeGhoul8863:
it says i can use the picture of the graph thats what imma do is just screen shot the graph and add it
AnimeGhoul8863:
oh are you talking about the the steps for graphing the function.
dude:
Yeah
AnimeGhoul8863:
ohh okie then i might need some help but ill do my best to do it my self
dude:
Okay
AnimeGhoul8863:
In this graph the equations \[y=\frac{ 4}{ 5 }x+1\left\{ x \le -1 \right\}\] and \[y=\frac{ 1 }{ 5 }x^2\left\{ x \ge -1 \right\}\] are set to make the line go until -1 and then the parabola will start at -1 this would create a curve going up then line that decreases down
AnimeGhoul8863:
hows this im probably wrong but what u think
dude:
Well technically its not bad but I think teachers are looking more at the order at which they are drawn Tip with LaTeX: If you don't want it to create new large lines, use `\(\)`, not `\[\]` An example ¶, might want to change this We start out at (-1,\(\large \frac15\)) and start going left 4 and down 5 units, plot a point at (-6,- 3.8). We draw an arrow because it goes on forever. Now for the second equation we start out at (-1,\(\large \frac15\)) and substitute values into the equation like x= 0 and x=1. After that we continue drawing the parabolic shape forever since it goes on forever Note, we can limit this all from \(\mathbb D\): -5 \(\le x\le 1\) too make the response easier to explain
AnimeGhoul8863:
what does that mean "we can limit this all from D"
help me dude I don't understand
dude:
https://www.desmos.com/calculator/zv95cu5rsv We can limit how far it extends (D is the domain)
help
I only have three hours and I'm also doing other homework
AnimeGhoul8863:
We start our graph at (-1,15) when doing this it start going left 4 and down 5 units. Once we have plotted a point at (-6,- 3.8). We drew an arrow because it goes on forever. For the second equation we start out at (-1,15) and substitute values into the equation like x= 0 and x=1. After that we continue drawing the parabolic shape forever since it goes on forever. Since it goes on forever We can limit how far it extends.
AnimeGhoul8863:
@dude Hows this for the final product e.e
dude:
Good
AnimeGhoul8863:
YAY!!! THANK YEW SO MUCH DUDEEE
dude:
No problemo
Join our real-time social learning platform and learn together with your friends!
 Bounty:
the world keeps moving fast and I'm stuck in a time lapse all I need is a minute
Bounty:
can I get so tips on how to start my journey into semi-realism art also on how to
Bounty:
the world keeps moving fast and I'm stuck in a time lapse all I need is a minute
Bounty:
can I get so tips on how to start my journey into semi-realism art also on how to
 Strawberryluna:
Read my poem. Im not for criticism its a poem I wrote after my breakup: Youu2019ll never understand the way you made me break, I hate that I still love you
Bounty:
first poem in a min- (tittle)? one moment i'm fine I smile till my face burns I laugh till I cant breath Then I cry I wonder where I went wrong I listen to
Strawberryluna:
Read my poem. Im not for criticism its a poem I wrote after my breakup: Youu2019ll never understand the way you made me break, I hate that I still love you
Bounty:
first poem in a min- (tittle)? one moment i'm fine I smile till my face burns I laugh till I cant breath Then I cry I wonder where I went wrong I listen to
 Twaylor:
3d printing a glider (for 150 pound 5'8 person - prolly should make it for up to
Twaylor:
3d printing a glider (for 150 pound 5'8 person - prolly should make it for up to
 cullenn:
pitter patter sound of rain gently tapping my window tonight. calming, soothing, right? not for me.
cullenn:
pitter patter sound of rain gently tapping my window tonight. calming, soothing, right? not for me.

 Arriyanalol:
DON'T BUY TICKETS TO SEAWORLD i watched a documentary on seaworld and its sad wha
Arriyanalol:
DON'T BUY TICKETS TO SEAWORLD i watched a documentary on seaworld and its sad wha
 natalieee:
who else wants a job in biology? I love biomedical science and want to work with
natalieee:
who else wants a job in biology? I love biomedical science and want to work with