 AnimeGhoul8863:
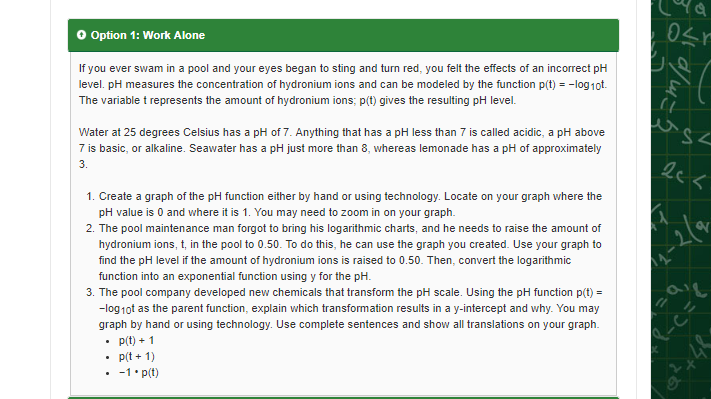
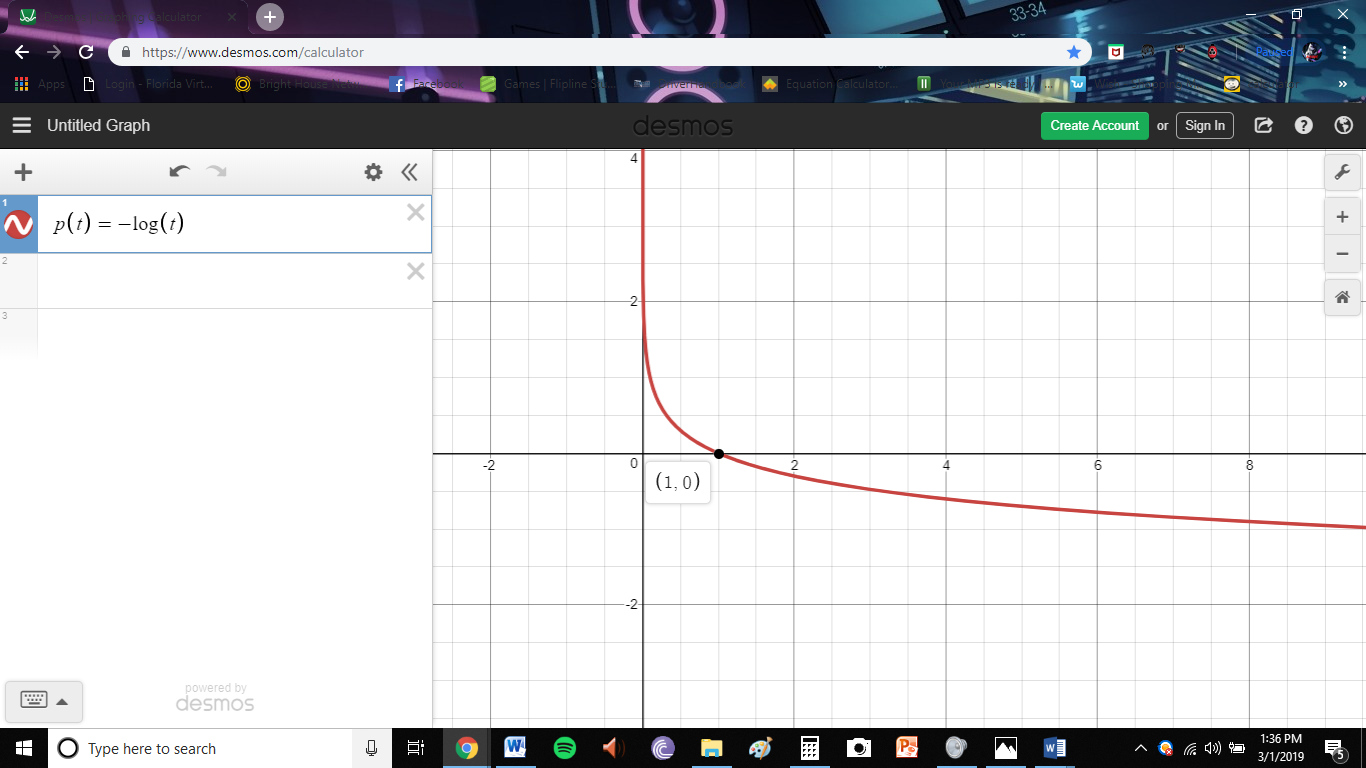
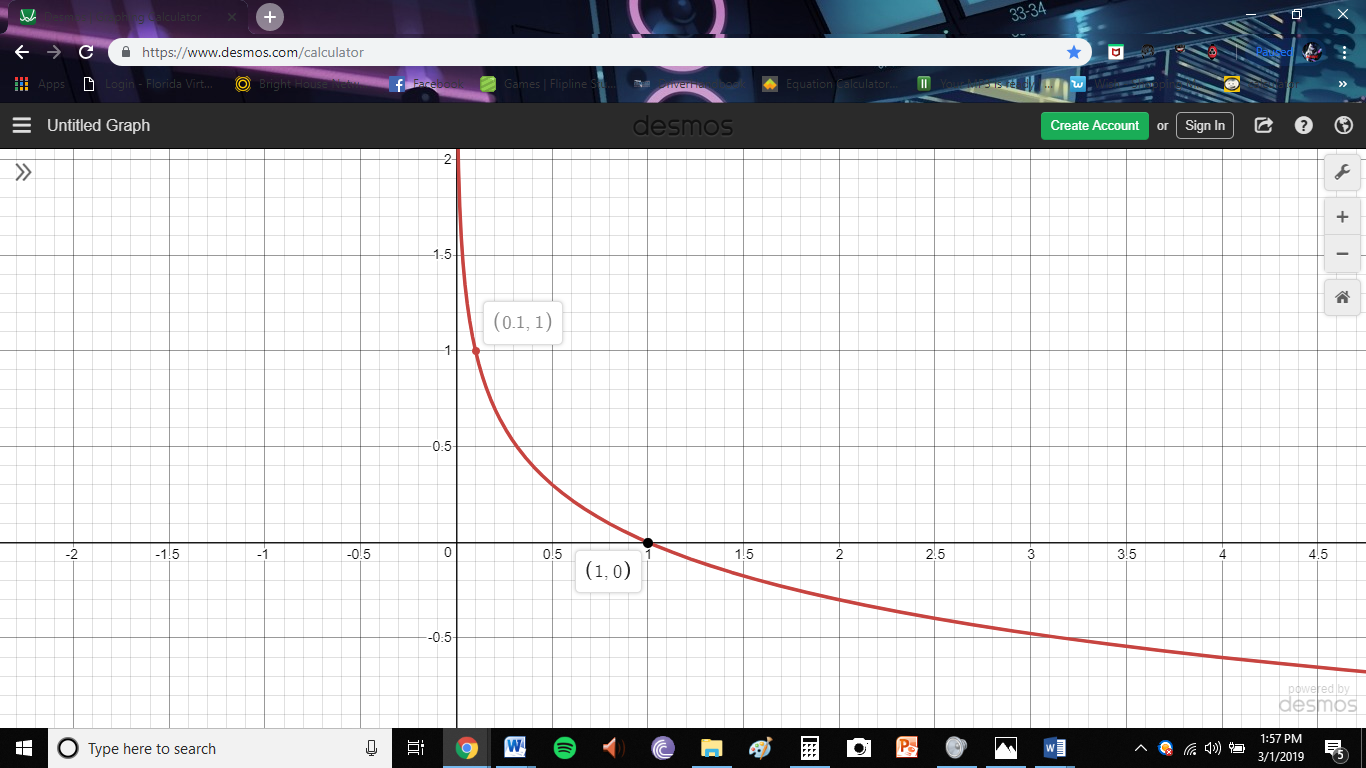
If you ever swam in a pool and your eyes began to sting and turn red, you felt the effects of an incorrect pH level. pH measures the concentration of hydronium ions and can be modeled by the function p(t) = −log10t. The variable t represents the amount of hydronium ions; p(t) gives the resulting pH level. Water at 25 degrees Celsius has a pH of 7. Anything that has a pH less than 7 is called acidic, a pH above 7 is basic, or alkaline. Seawater has a pH just more than 8, whereas lemonade has a pH of approximately 3. Create a graph of the pH function either by hand or using technology. Locate on your graph where the pH value is 0 and where it is 1. You may need to zoom in on your graph. The pool maintenance man forgot to bring his logarithmic charts, and he needs to raise the amount of hydronium ions, t, in the pool to 0.50. To do this, he can use the graph you created. Use your graph to find the pH level if the amount of hydronium ions is raised to 0.50. Then, convert the logarithmic function into an exponential function using y for the pH. The pool company developed new chemicals that transform the pH scale. Using the pH function p(t) = −log10t as the parent function, explain which transformation results in a y-intercept and why. You may graph by hand or using technology. Use complete sentences and show all translations on your graph. p(t) + 1 p(t + 1) −1 • p(t)
AnimeGhoul8863:
@dude could i get some help please?
AnimeGhoul8863:
@Hero Could i get some help please?
 dude:
dude:
Is the equation given \(p(t) = −log10t\) or \(p(t) = −log_{10} t\)
 AnimeGhoul8863:
^this is a screen shot to show u better
 Hero:
Hero:
@AnimeGhoul8863 if no equation is given then what would you call \(p(t) = -\log_{10}t\)?
AnimeGhoul8863:
ummmmmmm imma say Logarithmic? but im probably wrong i say this just because thats what the lesson was called
AnimeGhoul8863:
im really confused on this stuff
Hero:
What they want you to do is: 1. Locate the point on your graph where \(p(t) = 0\) and \(p(t) = 1\). In other words, you have to find the value of \(t\) that makes \(p(t) = 0\) and \(p(t) =1\) You can easily find these points using your graphing calculator. 2. Next they want you to find the value of \(p(t)\) when \(t = 0.50\). In other words you need to evaluate \(p(0.50)\). It will be a value between \(0\) and \(1\). 3. Now, you'll need to convert the log equation to an exponential equation. Keep in mind that \(y = log_b(x)\) is equivalent to \(b^y= x\) 4. For the last part you'll need to figure out which transformation gives an output for \(p\) when \(t = 0\).
AnimeGhoul8863:
1. Locate the point on your graph where p(t)=0 and p(t)=1. In other words, you have to find the value of t that makes p(t)=0 and p(t)=1 You can easily find these points using your graphing calculator. How do i do this on a graphing calculator how can u find points on a graph with no equation do i just put what they give me and put it in the p(t) = −log10t.?
AnimeGhoul8863:
i put p(t) = −log10t. in the desmos graphing calculator and the points it says is (0.1, 0)
Hero:
Put \(p(t) = -\log(t)\)
Hero:
Avoid using the 10. It will only confuse you
AnimeGhoul8863:
ok
Hero:
The 10 is supposed to be the base of the log but it is not necessary to use in this case. When you use log, the default base is already 10.
AnimeGhoul8863:
ok the point i got was (1,0)
Hero:
Very good
Hero:
Anyways, I have to get back to work. Post all your steps and I'll check them later.
AnimeGhoul8863:
ok....ill try my best but im still confused on what to do
Hero:
What are you confused on?
AnimeGhoul8863:
everything tbh
AnimeGhoul8863:
1. Locate the point on your graph where p(t)=0 and p(t)=1. In other words, you have to find the value of t that makes p(t)=0 and p(t)=1 You can easily find these points using your graphing calculator. if the point is (1,0) is that the value of t
Hero:
The format for points is \((t, p(t))\)
AnimeGhoul8863:
2. Next they want you to find the value of p(t) when t=0.50. In other words you need to evaluate p(0.50). It will be a value between 0 and 1. if the value of t=(1,0) how is it 0.50 how can u evaluate p(0.50) if its already inbetween 0 and 1
AnimeGhoul8863:
what
Hero:
Think of steps 1 and 2 as two completely separate tasks. Avoid mixing them up
Hero:
The format for points is like \((x,y)\) except in this case \(x = t\) and \(y = p(t)\)
AnimeGhoul8863:
ok so if p(t)=0 and p(t)=1 how does t make them (1,0)
AnimeGhoul8863:
i still dont know
Hero:
Well, yeah, you're clearly confused. I don't really have time to explain it all. It's one thing to be confused about the question itself. It's another thing to also be confused about function notation and points. You're confused about both, which makes explaining more complicated and more confusing for you.
 Hero:
Hero:
Where's the other point? I know desmos gave you that point you already found.
AnimeGhoul8863:
other point? it doesnt ask for another point Create a graph of the pH function either by hand or using technology. Locate on your graph where the pH value is 0 and where it is 1. You may need to zoom in on your graph.
AnimeGhoul8863:
it ask for a picture of the point on the graph i dont see where there would be a second point
AnimeGhoul8863:
ughh let me try to find a second point even tho i dont see where one can be
 AnimeGhoul8863:
?
 AnimeGhoul8863:
lets go to part b
AnimeGhoul8863:
The pool maintenance man forgot to bring his logarithmic charts, and he needs to raise the amount of hydronium ions, t, in the pool to 0.50. To do this, he can use the graph you created. Use your graph to find the pH level if the amount of hydronium ions is raised to 0.50. Then, convert the logarithmic function into an exponential function using y for the pH
AnimeGhoul8863:
Raising the Hydronium ions to 0.50 would raise the pH levels to 0.301. Once you found this you then can convert the Logarithmic function and in doing this we isolate the x and put it on one side and then take the 10 and put it on the other side creating -10y=x
AnimeGhoul8863:
i think this is what we do for this part but i could be wrong but i think its right
Hero:
Where is the equation that you graphed? You did not show that in your screenshot. I know how desmos works so why are you hiding that?
AnimeGhoul8863:
tbh i put it to the side so u could see the graph one second ill get u the other one
 AnimeGhoul8863:
i think this is it....yeah it is
Hero:
Okay, great. Your points are correct for part A
AnimeGhoul8863:
YAY!
AnimeGhoul8863:
and part b i did the best on
Hero:
As you stated earlier \(p(0.50) = 0.30\) which is also correct. Very good. I'm almost suspicious that someone helped you with this.
Hero:
BTW, Do you know to use carets when writing exponents in your equations?
Hero:
Because -10y=x is not correct as written.
AnimeGhoul8863:
carets no i dont think i have cause ive never heard it i dont think
AnimeGhoul8863:
let me look it up to see if i have
AnimeGhoul8863:
is carets where you do x^2
AnimeGhoul8863:
i see what u mean i think its suppose to be -10^y=x
AnimeGhoul8863:
is that better
Hero:
It's better
AnimeGhoul8863:
Ok now part C
AnimeGhoul8863:
The pool company developed new chemicals that transform the pH scale. Using the pH function p(t) = −log10t as the parent function, explain which transformation results in a y-intercept and why. You may graph by hand or using technology. Use complete sentences and show all translations on your graph. p(t) + 1 p(t + 1) −1 • p(t)
Hero:
Remember to use just \(p(t) = -\log(t)\) to express the function. What you copied and pasted above is not correct as written and imprinting the wrong equations into your mind will only confuse and frustrate you if you memorize the wrong ones.
AnimeGhoul8863:
huh?
AnimeGhoul8863:
oooo
AnimeGhoul8863:
The pool company developed new chemicals that transform the pH scale. Using the pH function p(t) = −log(t) as the parent function, explain which transformation results in a y-intercept and why. You may graph by hand or using technology. Use complete sentences and show all translations on your graph. p(t) + 1 p(t + 1) −1 • p(t)
AnimeGhoul8863:
better
Hero:
Very good.
AnimeGhoul8863:
so how do we do this for p(t) + 1 do we do ---> p(t) = −log(t) +1
AnimeGhoul8863:
o-o ultri why yew stalking
Hero:
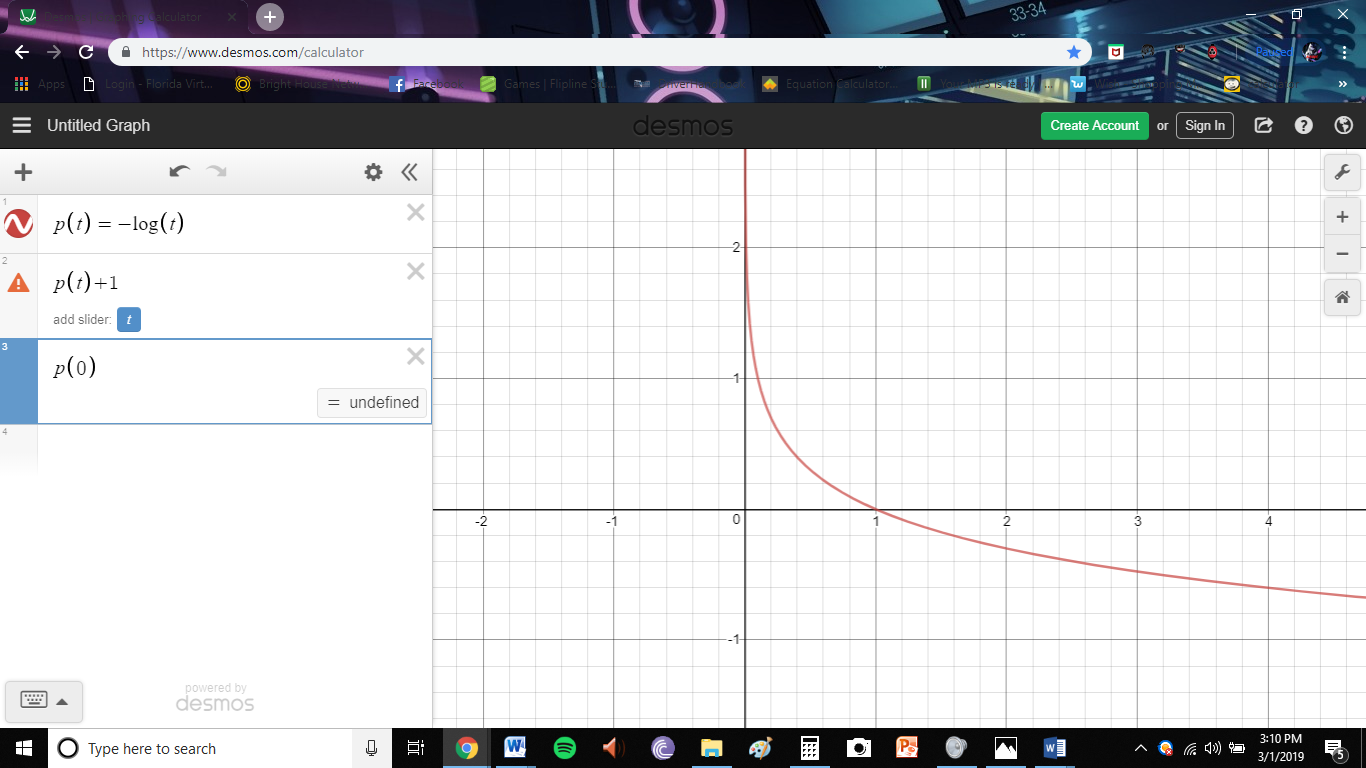
Here's what to do. Graph p(t) + 1 on desmos, then evaluate p(0). If you get an output, then you know the transformation produces a y-intercept. If not, try a different transformation.
AnimeGhoul8863:
evaluate p(0) how can u evaluate on demos?
AnimeGhoul8863:
*Desmos
AnimeGhoul8863:
@Hero e.e
Hero:
First graph the function \(p(t) + 1\) on the first line then evaluate \(p(0)\) on the next line.
 Hero:
Hero:
You want to graph the expression equivalent to \(p(t) + 1\)
Hero:
You were on the right track earlier
AnimeGhoul8863:
sorry i got confused let me look up
AnimeGhoul8863:
im still confused
Hero:
Why? As I said, you were on the right track earlier.
AnimeGhoul8863:
ik but i dont know how to use desmos what do u mean by "First graph the function p(t)+1 on the first line then evaluate p(0) on the next line. and You want to graph the expression equivalent to p(t)+1"
AnimeGhoul8863:
i put it on the second line but nothing happened im confused ik i was fine earlier but i done know what to do
Hero:
What is the expression for \(p(t)\)?
AnimeGhoul8863:
expression of p(t)?
AnimeGhoul8863:
ummmm
AnimeGhoul8863:
p(t) is y is that what ur asking
oh no do I have to do this too
Hero:
@AnimeGhoul8863, You already know the expression for \(p(t)\). It includes the \(\log\) function that was given.
AnimeGhoul8863:
OHHHH ok ....but what does that have to do with p(t)+1 and evaluating it with p(0)
AnimeGhoul8863:
i still dont know how to do that on desmos
never mind I think I did this already I'm in segment 2
AnimeGhoul8863:
Wooly this is segment 2
Hero:
@AnimeGhoul8863 you know that \(p(t) = -\log(t)\). So what happens if you add 1 to both sides?
AnimeGhoul8863:
like p(t)=-log(t) +1
Hero:
Did you add 1 to BOTH sides?
AnimeGhoul8863:
p(t)= +1-log(t)+1
AnimeGhoul8863:
?
Hero:
The other +1 goes on the other side of the equal sign.
Hero:
You added 1's to the same side, not both sides.
AnimeGhoul8863:
ok i get it now hold on i think
AnimeGhoul8863:
it still isnt working desmos says it only does x and y
Hero:
Remember, though you still have not posted the function here after adding 1 to both sides.
AnimeGhoul8863:
what
Hero:
\(\color{#0cbb34}{\text{Originally Posted by}}\) @Hero @AnimeGhoul8863 you know that \(p(t) = -\log(t)\). So what happens if you add 1 to both sides? \(\color{#0cbb34}{\text{End of Quote}}\)
Hero:
You never posted it correctly here.
AnimeGhoul8863:
p(t)+1=-log(t)+1
Hero:
Very good. Now, on Desmos, post it as \(q(t) = -\log(t) + 1\)
Hero:
Then evaluate \(q(0)\).
AnimeGhoul8863:
wait what......how did p(t)+1 turn into q(t) what was the point in adding the +1 to that side if we arnt going to use it
AnimeGhoul8863:
but ok....
Hero:
There's a procedure to this called "Understanding The process".
Hero:
Every step must be understood before moving on to the next step.
Hero:
We could have used \(p(t) + 1\) but Desmos refused to accept it.
Hero:
Using Geogebra is far better for tasks like these
AnimeGhoul8863:
ok
Hero:
Also it is important to realize the expression that is equivalent to \(p(t) + 1\). That is why I asked you to do it that way.
Hero:
We know \(p(t) = -\log(t)\) After adding 1 to both sides, it follows that \(p(t) + 1 = -\log(t) + 1\)
AnimeGhoul8863:
now how do i evaluate on desmos
Hero:
simply type q(0) in the next box after graphing q(t)
Hero:
Screenshot here to make sure that was done correctly.
 AnimeGhoul8863:
it wont work
Hero:
No, it worked. q(0) is undefined. What you were supposed to learn here was that if \(p(0)\) is undefined then \(p(0) + 1\) will also be undefined as adding 1 to both sides does not change the output.
Hero:
So we must try a different transformation.
AnimeGhoul8863:
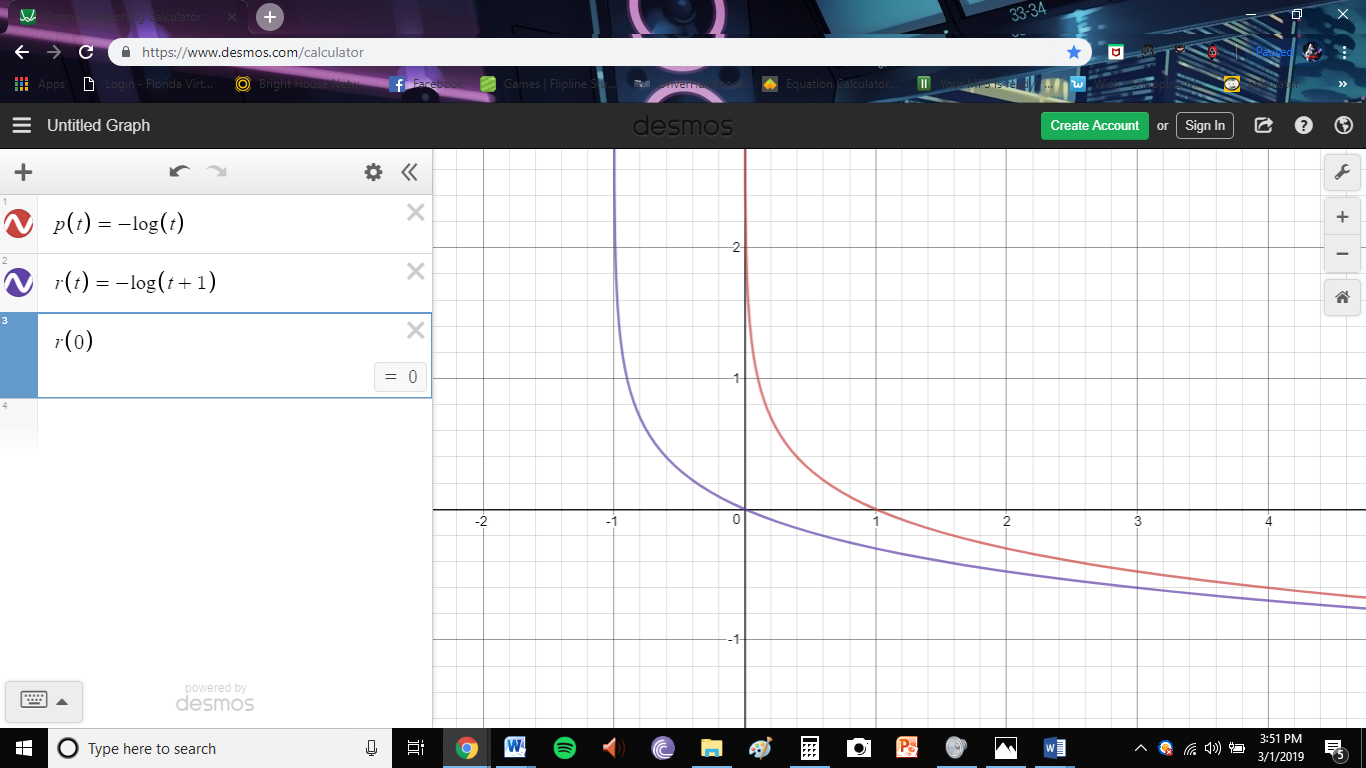
ok so we do this one p(t + 1) do we do p(t + 1)=-log(t +1)
Hero:
Correct. Graph it as r(t)
Hero:
Then evaluate r(0).
AnimeGhoul8863:
so r(t+1)=-log(t+1)
Hero:
We have to graph the expression on the right as r(t)
Hero:
so r(t) = -log(t + 1)
AnimeGhoul8863:
nothing happened
Hero:
Show me
 Hero:
Hero:
BTW, you forgot the negative and you did get an output for r(0).
Hero:
Remember, 0 is an integer.
 Hero:
Hero:
any number you get for an output even if 0, is still an output as 0 is indeed a number.
AnimeGhoul8863:
but nothing moved like the last one
AnimeGhoul8863:
but if 0 it is then ok
Hero:
What do you mean "nothing moved". The graph has been translated one unit to the right as it is supposed to.
Hero:
Do you not see that?
AnimeGhoul8863:
nothing moved but now i see on the corner instead of undefined it says 0
Hero:
Plot points (1,0) and (0,0) to help you understand that p(t + 1) is the graph of p(t) shifted one unit to the LEFT (not right)
Hero:
Other than that, I don't know what you're referring to when you say "nothing moved". The graph of p(t) is definitely shifted.
AnimeGhoul8863:
nvm
Hero:
What are you thinking is supposed to move besides the graph of p(t) one unit to the left?
AnimeGhoul8863:
i thought there was a point we are suppose to have this graph acted the same way as the last one thats why i said it didnt move
AnimeGhoul8863:
but anyway lets continue i need to get this finished
Hero:
Why would it act the same way when it is a different transformation?
AnimeGhoul8863:
because i thought it was wrong just like the first one
Hero:
We found our y-intercept which is the point (0,0). We're done with this step.
AnimeGhoul8863:
we are?
Hero:
y-intercept is the point where the graph hits the y-axis.
Hero:
And p(t + 1) hits the y-axis at (0,0). Do you not see this? You do know where the y-axis is or what it is rather, right?
AnimeGhoul8863:
i see it i got that part and yes i know where the y axis is its horizontal while x is vertical
Hero:
Okay, I figured you did. Just checkin'.
AnimeGhoul8863:
Okie cx sorry if i seem on edge math stresses me out more than anything
Hero:
but wait, you got that backwards actually. y is vertical, x is horizontal.
AnimeGhoul8863:
it is?
AnimeGhoul8863:
aww welp that took my moment away XD
Hero:
Yes, Horizontal means left to right direction. Vertical means up and down direction.
Hero:
I have to finish my work so finish up and I'll check what you did later.
AnimeGhoul8863:
Thanks Hero <3 i have to submit this right now but i believe its correct you helped me lots which means alot and sorry for getting confused math is just not my greatest subject
Hero:
You're welcome. Happy to help.
Join our real-time social learning platform and learn together with your friends!
 Bounty:
the world keeps moving fast and I'm stuck in a time lapse all I need is a minute
Bounty:
can I get so tips on how to start my journey into semi-realism art also on how to
Bounty:
the world keeps moving fast and I'm stuck in a time lapse all I need is a minute
Bounty:
can I get so tips on how to start my journey into semi-realism art also on how to
 Strawberryluna:
Read my poem. Im not for criticism its a poem I wrote after my breakup: Youu2019ll never understand the way you made me break, I hate that I still love you
Bounty:
first poem in a min- (tittle)? one moment i'm fine I smile till my face burns I laugh till I cant breath Then I cry I wonder where I went wrong I listen to
Strawberryluna:
Read my poem. Im not for criticism its a poem I wrote after my breakup: Youu2019ll never understand the way you made me break, I hate that I still love you
Bounty:
first poem in a min- (tittle)? one moment i'm fine I smile till my face burns I laugh till I cant breath Then I cry I wonder where I went wrong I listen to
 Twaylor:
3d printing a glider (for 150 pound 5'8 person - prolly should make it for up to
Twaylor:
3d printing a glider (for 150 pound 5'8 person - prolly should make it for up to
 cullenn:
pitter patter sound of rain gently tapping my window tonight. calming, soothing, right? not for me.
cullenn:
pitter patter sound of rain gently tapping my window tonight. calming, soothing, right? not for me.

 Arriyanalol:
DON'T BUY TICKETS TO SEAWORLD i watched a documentary on seaworld and its sad wha
Arriyanalol:
DON'T BUY TICKETS TO SEAWORLD i watched a documentary on seaworld and its sad wha
 natalieee:
who else wants a job in biology? I love biomedical science and want to work with
natalieee:
who else wants a job in biology? I love biomedical science and want to work with