 silvernight269:
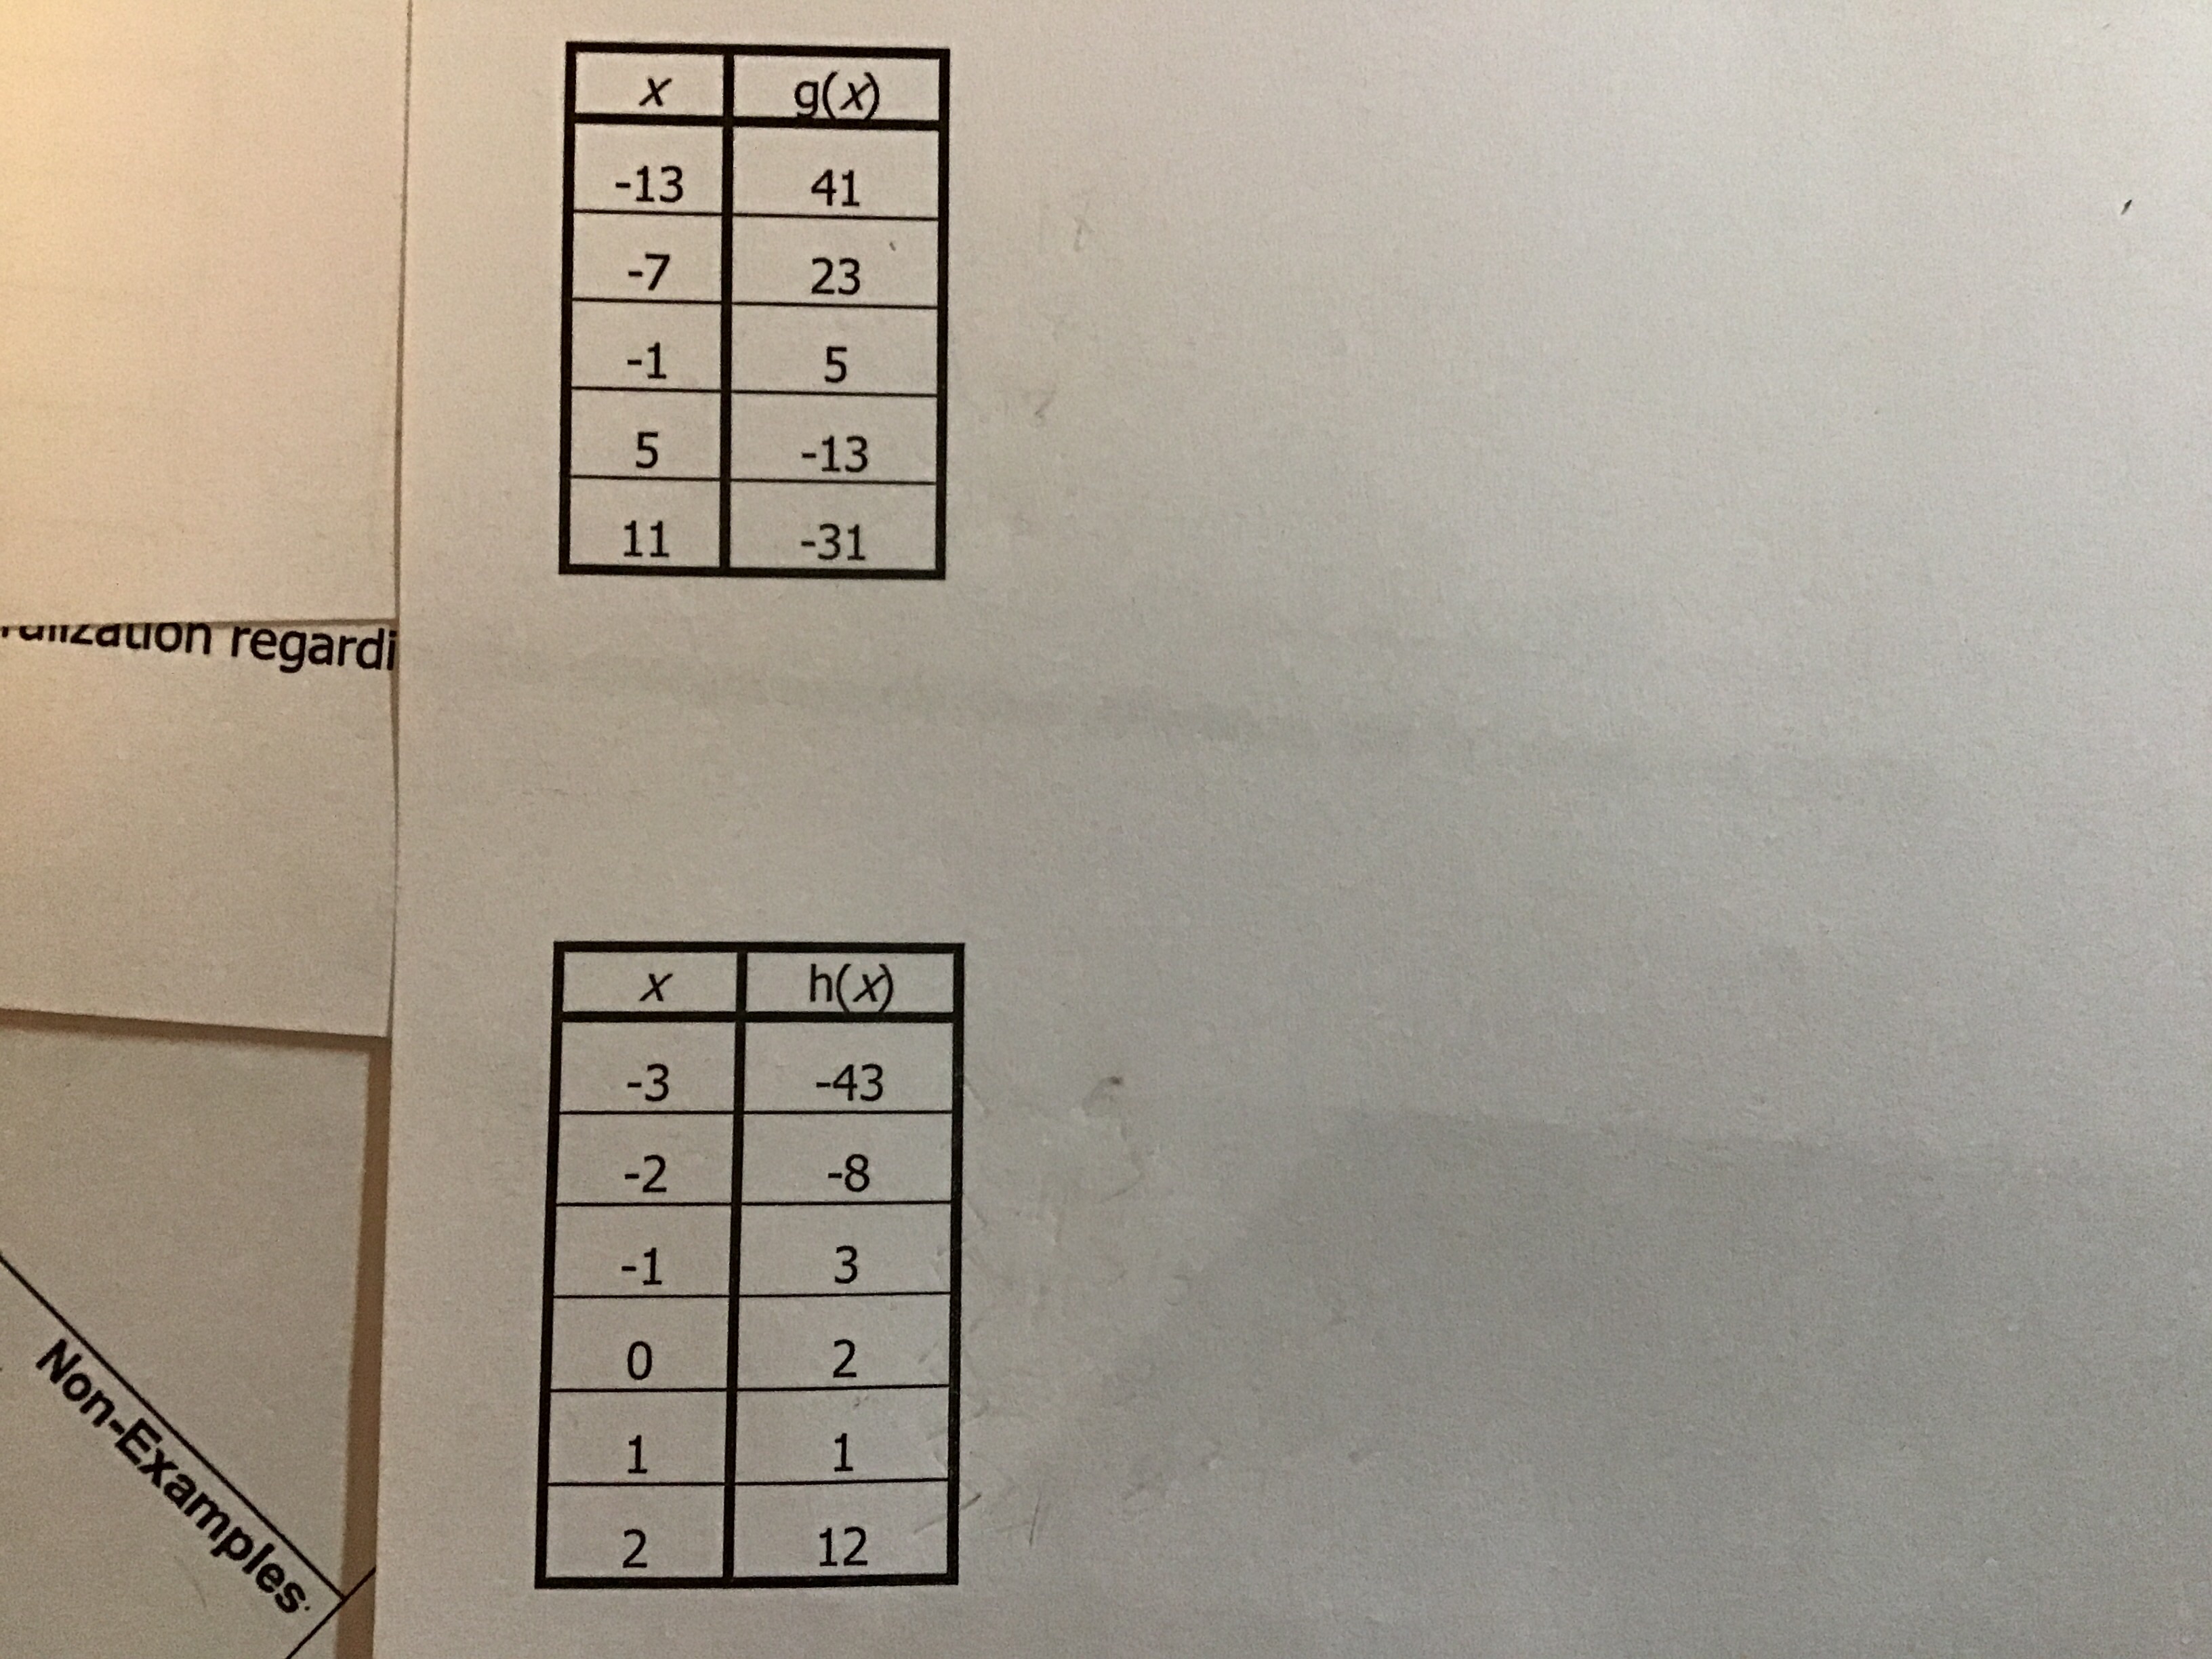
find the constant difference for each of the tables below. use these results to determine if each table represents a linear, quadratic, or a cubic function. then find the equation of each function.
 silvernight269:
@dude
 dude:
dude:
Sorry for the late response First find the slope for the first table Chose any 2 points (preferably ones next to each other) Say for example you choose (-13,41) and (-7,23) ( x\(_1\),\(y_1\)) (x\(_2\), \(y_2\)) Use the equation to find slope \(\large\frac{y_2-y_1}{x_2-x_1}=\frac{23-41}{-7-(-13)}\) Once you do that choose another two points Lets say you choose (-7,23) and (-1,5) ( x\(_1\),\(y_1\)) (x\(_2\), \(y_2\)) And use the same equation \(\large\frac{y_2-y_1}{x_2-x_1}=\frac{5-23}{-1-(-7)}\) If they are the same, then it is a linear function (they have the same slope)
dude:
From them you can just use any point (from the table) and substitute what you have to find the y-intercept
dude:
For the second table we can clearly see that they are not going on a constant rate In terms of it being a quadratic function, the points would be the same on both positive and negative values after it reaches its vertex
dude:
So it is automatically a cubic function (I am not sure how to fully explain this however here is the graph and so I hope it does help, will try to explain though) https://www.desmos.com/calculator/uu5ygqwf24
Join our real-time social learning platform and learn together with your friends!
 Bounty:
the world keeps moving fast and I'm stuck in a time lapse all I need is a minute
Bounty:
can I get so tips on how to start my journey into semi-realism art also on how to
Bounty:
the world keeps moving fast and I'm stuck in a time lapse all I need is a minute
Bounty:
can I get so tips on how to start my journey into semi-realism art also on how to
 Strawberryluna:
Read my poem. Im not for criticism its a poem I wrote after my breakup: Youu2019ll never understand the way you made me break, I hate that I still love you
Bounty:
first poem in a min- (tittle)? one moment i'm fine I smile till my face burns I laugh till I cant breath Then I cry I wonder where I went wrong I listen to
Strawberryluna:
Read my poem. Im not for criticism its a poem I wrote after my breakup: Youu2019ll never understand the way you made me break, I hate that I still love you
Bounty:
first poem in a min- (tittle)? one moment i'm fine I smile till my face burns I laugh till I cant breath Then I cry I wonder where I went wrong I listen to
 Twaylor:
3d printing a glider (for 150 pound 5'8 person - prolly should make it for up to
Twaylor:
3d printing a glider (for 150 pound 5'8 person - prolly should make it for up to
 cullenn:
pitter patter sound of rain gently tapping my window tonight. calming, soothing, right? not for me.
cullenn:
pitter patter sound of rain gently tapping my window tonight. calming, soothing, right? not for me.

 Arriyanalol:
DON'T BUY TICKETS TO SEAWORLD i watched a documentary on seaworld and its sad wha
Arriyanalol:
DON'T BUY TICKETS TO SEAWORLD i watched a documentary on seaworld and its sad wha
 natalieee:
who else wants a job in biology? I love biomedical science and want to work with
natalieee:
who else wants a job in biology? I love biomedical science and want to work with