 12123333333333333333:
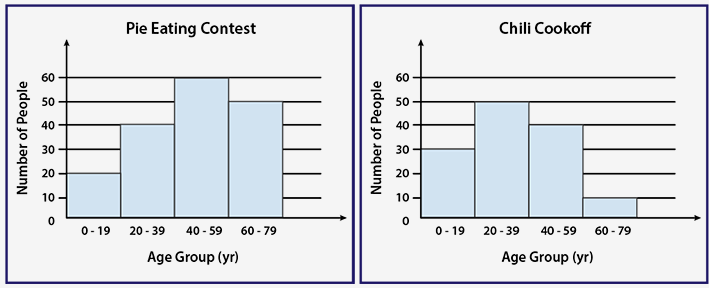
A class of 20 students is visiting the fair today. Each student is 16 years old or younger and will participate in either the Pie Eating Contest or the Chili Cookoff. If all 20 students joined the same event, how would the shape of the histogram change compared to the original? Histogram with title Pie Eating Contest, horizontal axis labeled Age Group (year) with bins 0 to 19, 20 to 39, 40 to 59, and 60 to 79 and vertical axis labeled Number of People with values from 0 to 60 at intervals of 10. The first bin goes to 20, the second goes to 40, the third goes to 60, and the last goes to 50. Histogram with title Chili Cookoff, horizontal axis labeled Age Group (year) with bins 0 to 19, 20 to 39, 40 to 59, and 60 to 79 and vertical axis labeled Number of People with values from 0 to 60 at intervals of 10. The first bin goes to 30, the second goes to 50, the third goes to 40, and the last goes to 10. The Chili Cookoff would be more skewed. The Pie Eating Contest would be more skewed. The Pie Eating Contest would be less symmetrical.
 Nnesha:
What if you post the graph instead of this paragraph `Histogram with title Pie Eating Contest, horizontal axis labeled Age Group (year) with bins 0 to 19, 20 to 39, 40 to 59, and 60 to 79 and vertical axis labeled Number of People with values from 0 to 60 at intervals of 10. The first bin goes to 20, the second goes to 40, the third goes to 60, and the last goes to 50. Histogram with title Chili Cookoff, horizontal axis labeled Age Group (year) with bins 0 to 19, 20 to 39, 40 to 59, and 60 to 79 and vertical axis labeled Number of People with values from 0 to 60 at intervals of 10. The first bin goes to 30, the second goes to 50, the third goes to 40, and the last goes to 10.`
 justjm:
The central limit theorem indicates that as the sample size increases, the distribution becomes more normal. Graphically, that takes the Gaussian curve and is symmetric. Here, the original graphs show more than a 100 people participating, and now supposedly your sample size has decreased to 20. Since the sample size decreased, by the inverse of the central limit theorem, what do you think is the answer?
12123333333333333333:
Okay I am dumb and have noo clue what you just said :|
justjm:
Sorry I shouldve explained it better and kind of mistated the CLT Basically as the sample size increases, the curve follows the sampling distribution of the population, with the mean and standard deviation getting closer to the actual amt. Unless I've understood it wrong, the graphs shown have sample sizes much greater than the class of 20 students correct? So your sample size has decreased. This means that the sample curve's sampling distribution skew or symmetry is less. So what do you think
12123333333333333333:
Uhhh...The Pie Eating Contest would be less symmetrical.?
justjm:
Close, remember how I said that the sampling distribution of the sample gets closer to that of the population when sampling size increases. Here the sampling distribution is skewed, so lowering its sample size will lower its _____
justjm:
I mean increase* its _____
12123333333333333333:
The Pie Eating Contest would be more skewed??
justjm:
Yeah I would go for that one
12123333333333333333:
Okay can you check one other one?
justjm:
Is it a check all that apply question?
12123333333333333333:
No...
12123333333333333333:
I am just asking you could look over it..
12123333333333333333:
see if I got it right...
justjm:
Where is the other question
12123333333333333333:
The data to represent average test scores for a class of 16 students includes an outlier value of 91. If the outlier is included, then the mean is 80. Which statement is always true about the new data when the outlier is removed? The median would increase. The mean would decrease. -This one? The mean would increase.
justjm:
yes that's right
12123333333333333333:
thx
justjm:
Oh and yeah for the first one, you were correct originally, it's C
Join our real-time social learning platform and learn together with your friends!
 Bounty:
the world keeps moving fast and I'm stuck in a time lapse all I need is a minute
Bounty:
can I get so tips on how to start my journey into semi-realism art also on how to
Bounty:
the world keeps moving fast and I'm stuck in a time lapse all I need is a minute
Bounty:
can I get so tips on how to start my journey into semi-realism art also on how to
 Strawberryluna:
Read my poem. Im not for criticism its a poem I wrote after my breakup: Youu2019ll never understand the way you made me break, I hate that I still love you
Bounty:
first poem in a min- (tittle)? one moment i'm fine I smile till my face burns I laugh till I cant breath Then I cry I wonder where I went wrong I listen to
Strawberryluna:
Read my poem. Im not for criticism its a poem I wrote after my breakup: Youu2019ll never understand the way you made me break, I hate that I still love you
Bounty:
first poem in a min- (tittle)? one moment i'm fine I smile till my face burns I laugh till I cant breath Then I cry I wonder where I went wrong I listen to
 Twaylor:
3d printing a glider (for 150 pound 5'8 person - prolly should make it for up to
Twaylor:
3d printing a glider (for 150 pound 5'8 person - prolly should make it for up to
 cullenn:
pitter patter sound of rain gently tapping my window tonight. calming, soothing, right? not for me.
cullenn:
pitter patter sound of rain gently tapping my window tonight. calming, soothing, right? not for me.

 Arriyanalol:
DON'T BUY TICKETS TO SEAWORLD i watched a documentary on seaworld and its sad wha
Arriyanalol:
DON'T BUY TICKETS TO SEAWORLD i watched a documentary on seaworld and its sad wha
 natalieee:
who else wants a job in biology? I love biomedical science and want to work with
natalieee:
who else wants a job in biology? I love biomedical science and want to work with