 kittybasil:
[ EXCEL | COMPUTER SCIENCE ] Part 1 Help extracting data in a manner that helps resolve other questions? (apologies, I think I used the word "extrapolating" wrong)
 kittybasil:
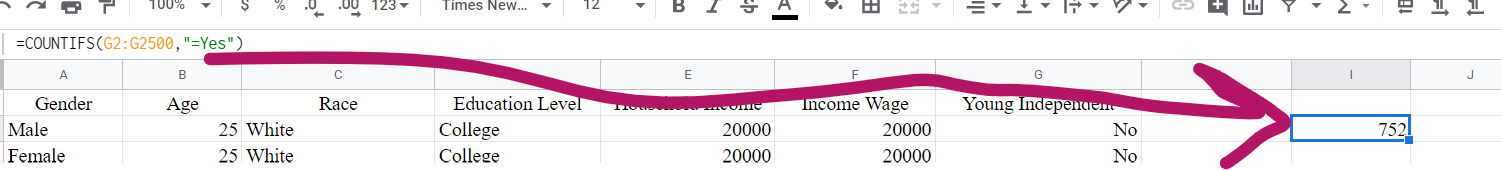
- The number of "Young Independents" (20 and younger; live alone)
- Mean age of all females
- Median Income Wage of those who did not go to college
- The median Household Income of African American females. (Hint: you may want to create an intermediary column to calculate this)
kittybasil:
Red text involves concepts that I am unfamiliar with. I know most of the formulas for the rest of the questions.
-
{*]The number of males who only completed high school
- The number of Asian females who went to college
- Of all American Indians, what percent only completed high school? (Hint: pretend there is a % sign after your number, e.g. enter 1/4 as 25.00, not as 0.25)
- Of all White males, what percent attended college? (Hint: pretend there is a % sign after your number, e.g. enter 1/4 as 25.00, not as 0.25)
- In our sample, females are more likely to be college students than males. Is this observation consistent within all the races in our sample? Pick ALL races for which females are more likely to be college students. (Options given: African American, American Indian, Asian, White, Other)
- Create a pivot CHART to show your answer to the previous question graphically. Use the provided upload box to submit your pivot chart—you should be able to upload a screenshot, the Excel file, print it to a PDF, whatever works for you. (Hint: Your pivot chart should be a bar graph comparing the percentage of college students in each gender by race)
kittybasil:
@Shadow @TheSmartOne @imqwerty
kittybasil:
Formulas I'm aware of:
- IF/Nested IF
- SWITCH
- Mean/median/mode
kittybasil:
@Hero
 Razor:
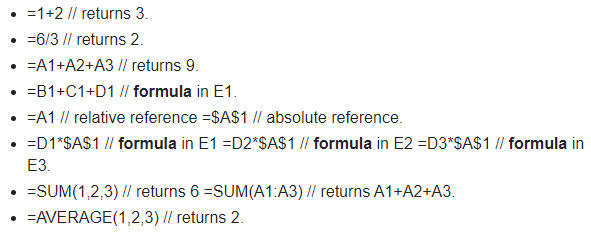
I don't think I can help you completely. But I can maybe help a little if I understand? Are you aware of these functions?
 kittybasil:
...I don't get the first two.
Razor:
I never used those in my class. You won't have to worry about those unless you need to. But in short, it's basically you putting in 1+2 and then the software should solve it for you, or with the other given 6/2 = 3 <- It'd give you that answer. Does that make sense?
kittybasil:
So treating Excel like your basic desk calculator... okay
Razor:
Yes, exactly! Anything else you don't understand?
kittybasil:
I mean, I was thinking stuff more along the line of IF and SWITCH as previously mentioned 😰
Razor:
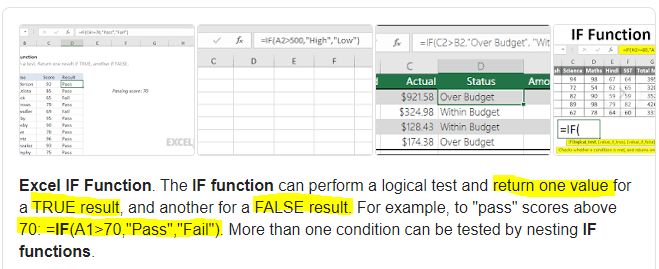
Hmm... Well, I know that the IF function is supposed to differ from a TRUE and FALSE statement or logical test. Let me pull up the Google Definition for you because they explain it better.
 Razor:
I've highlighted what makes more sense to narrow it down for you.
kittybasil:
I know how to do those 😅 I just wondered if I needed more stuff like that to get all of these questions answered
Razor:
Ohhhhh, I'm sorry. I misunderstood the situation. Well, I would say you could use the IF function when it comes down to comparing a hypothetical answer to another. And the SWITCH function for one vs. many situations. Did that make sense?
kittybasil:
Er... not what I meant 💀 are there more formulas I need to know to solve all of these?
Razor:
Daaa... maybe the SUM or AVERAGE function when you think you need to use it. Other than that I don't think so
kittybasil:
I mean, the stuff that throws me off the most is "the mean age of all females" how am I supposed to calculate that?
kittybasil:
Admittedly I probably should know, but blanking right now
Razor:
So am I, I'm sorry that it took so long for me to realize XD
kittybasil:
💀
Razor:
The keyword is mean, so you'd need to use the MEAN/MODE/MEDIAN function. If that's what it's still called
kittybasil:
It is, but idk how to calculate gender-specific because that's in another column entirely
kittybasil:
I don't think formulas can apply to 2 columns at once
Razor:
I'm not sure about that one
kittybasil:
Ok I went and looked at the last time I did an Excel sheet like this and I figured out how to calculate that stuff But still stuck on Pivot tables
Razor:
What do you mean by stuck? How to make one or?
kittybasil:
...wait how do I find the NUMBER of Young Dependents of all things? The list is cleaned up but how do you find specific numbers -- 😖
Razor:
Does the assignment say you need to find specific numbers or to estimate

 kittybasil:
Ok internet tells me use COUNTIFS for the first question.
Razor:
Pretty simple. For part 3 it says "consistent" meaning you won't need the EXACT amount. Or I'm pretty sure, like 98% sure about that one. Though you would need to use the AVERAGE function for that. If you can.
Razor:
I forgot all about that one. GG
kittybasil:
I think I get the gist of how to do these once I find the formula, but parameters are tricky things and they mess up EVERYTHING if you do them wrong. 💀
 Hero:
Hero:
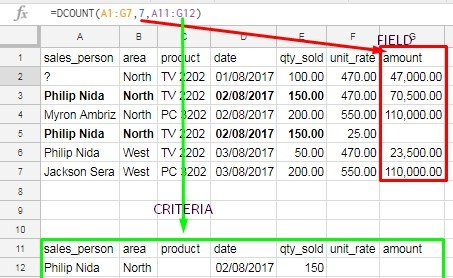
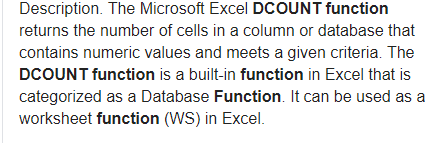
Using google sheets, use the DCOUNT function to find the number young dependents age 20 or younger. Use the DAVERAGE function to find the mean age of all females. Then use the MEDIAN function to find the MEDIAN wage of those who did not go to college.
kittybasil:
Ok, noted. I'll go work on those ASAP
kittybasil:
read a DCOUNT manual and did not understand at all
 kittybasil:
Oh nvm, I found the Sheets infopage
Razor:
:kanawhat:
kittybasil:
^ ? Nope, I still don't get DCOUNT.
 Hero:
Hero:
It's only for numeric values, but you can convert Male and Female to numeric values by assigning MALE = 1 and Female = 2
kittybasil:
I mean, I get what it's used for, but looking up how to use it (I also looked up YouTube videos) has not helped me understand at all
kittybasil:
What about COUNTIFS( ?
Hero:
Not sure if that works with G SHEETS
kittybasil:
I mean, I looked up DCOUNT & it seems like it has too many parameters that I don't have
 kittybasil:
...I don't know how to calculate MEAN with this though
Razor:
Yay! I was at my limit and didn't know what else to do. But uh, what're you having trouble with MEAN wise
kittybasil:
Oops, let me try DAVERAGE
Razor:
Tell me how that works out
kittybasil:
It said I have to put "MALE" when I put "FEMALE" @Hero is this a parameter error?
kittybasil:
Formula: =DAVERAGE(A2:A2500,"Female",B2:B2500) Range 1 is the gender list, Range 2 is the age list
Razor:
I think this is where my skills end unless I start googling things
kittybasil:
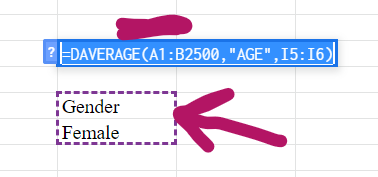
Oh, I fixed it Like this, right? =DAVERAGE(A1:B2500,"AGE",I5:I6)
kittybasil:
I5:I6 is a new cell set I used to specify criteria properly. It looks like this:
 Razor:
It's like Access all over again. I think the formula looks right, I could be wrong. Don't take my word for it
kittybasil:
I think I have those questions down. Stuck on the last one in Part 1 now... "The median Household Income of African American females. (Hint: you may want to create an intermediary column to calculate this)" Uh... what's an intermediary column?
Razor:
The the... those charts that you use in the columns and rows. Er
kittybasil:
Internal screaming
kittybasil:
I really, really hate parameter errors.
Razor:
UHHH what do you have so far?
kittybasil:
For which one? @Razor
Razor:
For you intermediary column?
kittybasil:
Yeah - I don't even know, internet tells me nothing
 Hero:
Hero:
It's easier to calculate things when you convert the categorical data to numerical data. It's important to know how to do that.
kittybasil:
...?
kittybasil:
Ok, this is getting a little long. I'll close this and make a new post
Join our real-time social learning platform and learn together with your friends!
 Bounty:
the world keeps moving fast and I'm stuck in a time lapse all I need is a minute
Bounty:
can I get so tips on how to start my journey into semi-realism art also on how to
Bounty:
the world keeps moving fast and I'm stuck in a time lapse all I need is a minute
Bounty:
can I get so tips on how to start my journey into semi-realism art also on how to
 Strawberryluna:
Read my poem. Im not for criticism its a poem I wrote after my breakup: Youu2019ll never understand the way you made me break, I hate that I still love you
Bounty:
first poem in a min- (tittle)? one moment i'm fine I smile till my face burns I laugh till I cant breath Then I cry I wonder where I went wrong I listen to
Strawberryluna:
Read my poem. Im not for criticism its a poem I wrote after my breakup: Youu2019ll never understand the way you made me break, I hate that I still love you
Bounty:
first poem in a min- (tittle)? one moment i'm fine I smile till my face burns I laugh till I cant breath Then I cry I wonder where I went wrong I listen to
 Twaylor:
3d printing a glider (for 150 pound 5'8 person - prolly should make it for up to
Twaylor:
3d printing a glider (for 150 pound 5'8 person - prolly should make it for up to
 cullenn:
pitter patter sound of rain gently tapping my window tonight. calming, soothing, right? not for me.
cullenn:
pitter patter sound of rain gently tapping my window tonight. calming, soothing, right? not for me.

 Arriyanalol:
DON'T BUY TICKETS TO SEAWORLD i watched a documentary on seaworld and its sad wha
Arriyanalol:
DON'T BUY TICKETS TO SEAWORLD i watched a documentary on seaworld and its sad wha
 natalieee:
who else wants a job in biology? I love biomedical science and want to work with
natalieee:
who else wants a job in biology? I love biomedical science and want to work with