 rileyvc:
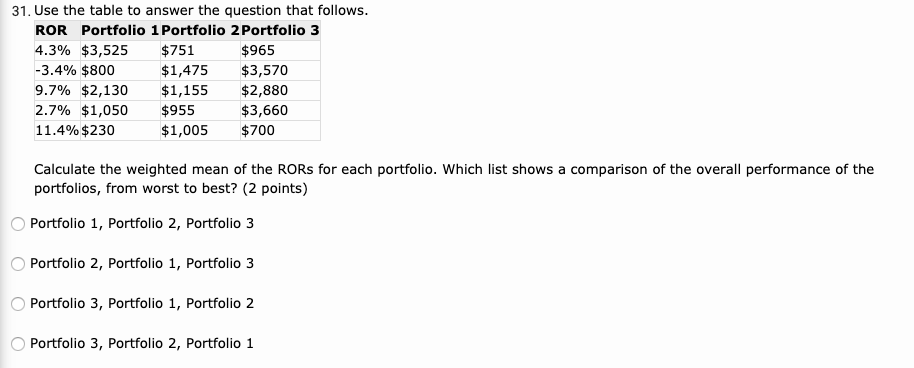
Use the table to answer the question that follows. ROR Portfolio 1 Portfolio 2 Portfolio 3 4.3% $3,525 $751 $965 -3.4% $800 $1,475 $3,570 9.7% $2,130 $1,155 $2,880 2.7% $1,050 $955 $3,660 11.4% $230 $1,005 $700 Calculate the weighted mean of the RORs for each portfolio. Which list shows a comparison of the overall performance of the portfolios, from worst to best? A. Portfolio 1, Portfolio 2, Portfolio 3 B. Portfolio 2, Portfolio 1, Portfolio 3 C. Portfolio 3, Portfolio 1, Portfolio 2 D. Portfolio 3, Portfolio 2, Portfolio 1 This is the last resort :( Any help (or the answer with an explanation) would be so appreciated.
 darkknight:
do you think you could reformat the table?
darkknight:
Use the attach file button
rileyvc:
yes! I will do that rn.
 darkknight:
@dude, @imqwerty @InsatiableSuffering
darkknight:
So we are supposed to calculate the weighted mean of the ROR's for each profile. RAte of return. Does this mean that we calculate the percentage for each profile in each of the rate of returns and find the average?
darkknight:
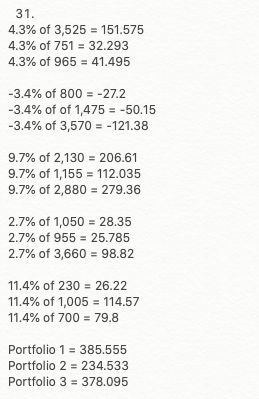
I am pretty sure that is what we have to do so lets start workin! So take 4.3% of 3525 than 4.3% of 751, than 4.3% of 965. than -3.4% of 800, than -3.4% of 1475... (you get the idea.) what you do is add all the values u got for profile 1 with each other, profile 2 with each other, and profile 3 with each other. then mark the answer choice from worst to best
rileyvc:
That sounds right!
rileyvc:
Man I hate this so much, so much busywork math
darkknight:
Okay, that that kind of confirms what I said. So ik its a lotta calculating but you have to do that. Add up the different profile values with each other so that you have the total values for profile 1, 2 and 3. Than rank them :)
rileyvc:
Is there a way I can use a vector to make this less of a pain in the butt or am I stuck doing it manually?
darkknight:
There might be another way. I am not sure of it. this might be pretty not time efficient. Is there a way your teacher has told you?
rileyvc:
Not gonna lie, my teacher hasn't really taught me anything noteworthy. I've been figuring it out on my own but I haven't been able to grasp this stuff
rileyvc:
Which is very unfortunate for me lol
 imqwerty:
\(\color{#0cbb34}{\text{Originally Posted by}}\) @rileyvc Is there a way I can use a vector to make this less of a pain in the butt or am I stuck doing it manually? \(\color{#0cbb34}{\text{End of Quote}}\) are you allowed to use calculators?
rileyvc:
@imqwerty yes
imqwerty:
you could use matrix multiplication to make calculations a bit easier
rileyvc:
@imqwerty I haven't used matrices since taking statistics :|
imqwerty:
You may check it out if you want, it's convenient when you have a make a lot of similar calculations like in this case we need to calculate the weighted mean three times. All you need to do is fill in the appropriate entries in matrices and do the multiplication. |dw:1589505279544:dw|
imqwerty:
it does the multiplication and shows the answers in the result matrix
imqwerty:
another way to make calculations easier and more interesting would be to write a program to do it
rileyvc:
Thank you! I'm finishing my calculations now, I'll share the answer I get.
rileyvc:
Portfolio 1 = 385.555 Portfolio 2 = 234.533 Portfolio 3 = 378.095 This is what I got, I double-checked my calculations. According to this though, wouldn't worst-->best order be 2, 3, 1? But that isn't an answer I can choose. What am I missing here?
rileyvc:
\(\color{#0cbb34}{\text{Originally Posted by}}\) @rileyvc Portfolio 1 = 385.555 Portfolio 2 = 234.533 Portfolio 3 = 378.095 This is what I got, I double-checked my calculations. According to this though, wouldn't worst-->best order be 2, 3, 1? But that isn't an answer I can choose. What am I missing here? \(\color{#0cbb34}{\text{End of Quote}}\) @darkknight @imqwerty ?
imqwerty:
There probably some calculation error. How did you calculate those values?
rileyvc:
@imqwerty I did it manually the way that @darkknight suggested
 imqwerty:
to calculate the weighted mean you have to multiply the rate with the amount in each line add those up and then divide the total sum by the sum of amounts
imqwerty:
you didn't divide by the sum of amounts
rileyvc:
So I add the values of all three portfolios to get the total sum. What's the sum of amounts? I'm sorry if that's dumb
imqwerty:
\(\color{#0cbb34}{\text{Originally Posted by}}\) @rileyvc Portfolio 1 = 385.555 Portfolio 2 = 234.533 Portfolio 3 = 378.095 This is what I got, I double-checked my calculations. According to this though, wouldn't worst-->best order be 2, 3, 1? But that isn't an answer I can choose. What am I missing here? \(\color{#0cbb34}{\text{End of Quote}}\) what you calculated is the total returns, we can't say that portfolio1 is better than portfolio2 just by seeing their total returns. We need to see returns/$. (which is nothing but the weighted mean) For example, a return of $100 for an amount of $100 and a return of $10 for an amount of $1. We can't directly compare $100 and $10 and say that the former is better. We need to see returns/$. So in this case that would be $100/$100 = 1 and $10/$1 = 10. So the second one is better. What we need to do for the given question is this- for portfolio1 -> \(\large\frac{4.3×3525÷100 − 800×3.4÷100 + 2130×9.7÷100 + 1050 × 2.7÷100 + 230×11.4÷100}{3525 + 800+ 2130+ 1050 + 230}\)
rileyvc:
I got 0.04984550743 for portfolio 1. is that correct?
imqwerty:
yes
rileyvc:
I got B. Is that what you got?
imqwerty:
it's probably correct if you did the calculations right, I didn't do the calculations
rileyvc:
((4.3×751÷100−1,475×3.4÷100+1,155×9.7÷100+955×2.7÷100+1,005 ×11.4÷100)/ (751+1,475+1,155+955+1,005)) = 0.04391181426; These were my calculations for Portfolio 2.
darkknight:
That looks right for 2
rileyvc:
Thank you!
imqwerty:
yw
rileyvc:
Okay, I checked again and I got D.
imqwerty:
okay
rileyvc:
D was correct! Thank you for the help.
imqwerty:
yw! :-)
Join our real-time social learning platform and learn together with your friends!
 Bounty:
the world keeps moving fast and I'm stuck in a time lapse all I need is a minute
Bounty:
can I get so tips on how to start my journey into semi-realism art also on how to
Bounty:
the world keeps moving fast and I'm stuck in a time lapse all I need is a minute
Bounty:
can I get so tips on how to start my journey into semi-realism art also on how to
 Strawberryluna:
Read my poem. Im not for criticism its a poem I wrote after my breakup: Youu2019ll never understand the way you made me break, I hate that I still love you
Bounty:
first poem in a min- (tittle)? one moment i'm fine I smile till my face burns I laugh till I cant breath Then I cry I wonder where I went wrong I listen to
Strawberryluna:
Read my poem. Im not for criticism its a poem I wrote after my breakup: Youu2019ll never understand the way you made me break, I hate that I still love you
Bounty:
first poem in a min- (tittle)? one moment i'm fine I smile till my face burns I laugh till I cant breath Then I cry I wonder where I went wrong I listen to
 Twaylor:
3d printing a glider (for 150 pound 5'8 person - prolly should make it for up to
Twaylor:
3d printing a glider (for 150 pound 5'8 person - prolly should make it for up to
 cullenn:
pitter patter sound of rain gently tapping my window tonight. calming, soothing, right? not for me.
cullenn:
pitter patter sound of rain gently tapping my window tonight. calming, soothing, right? not for me.

 Arriyanalol:
DON'T BUY TICKETS TO SEAWORLD i watched a documentary on seaworld and its sad wha
Arriyanalol:
DON'T BUY TICKETS TO SEAWORLD i watched a documentary on seaworld and its sad wha
 natalieee:
who else wants a job in biology? I love biomedical science and want to work with
natalieee:
who else wants a job in biology? I love biomedical science and want to work with