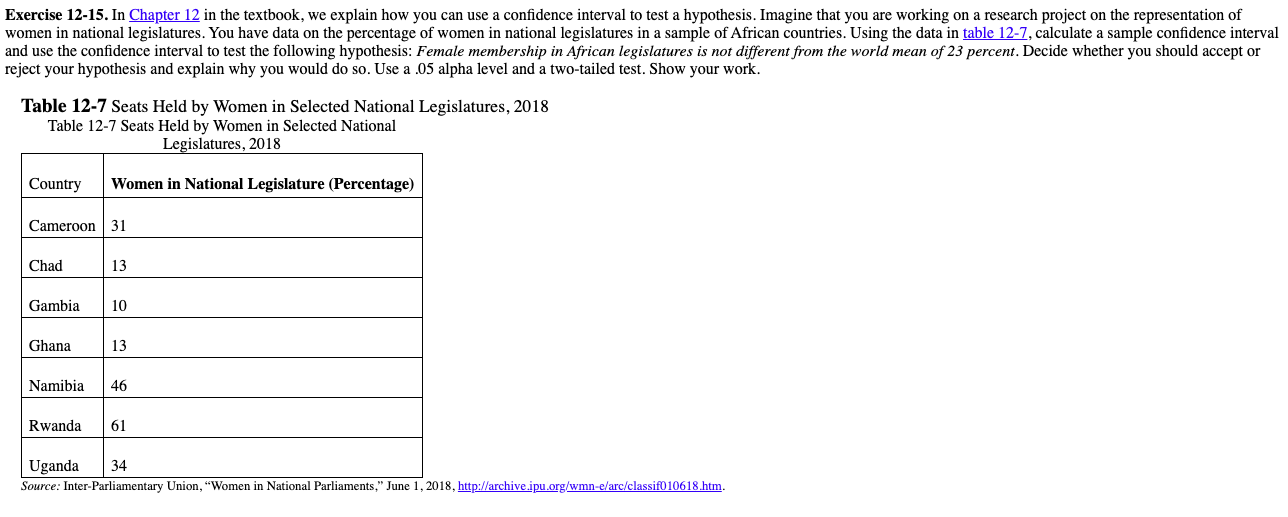
 candycove:
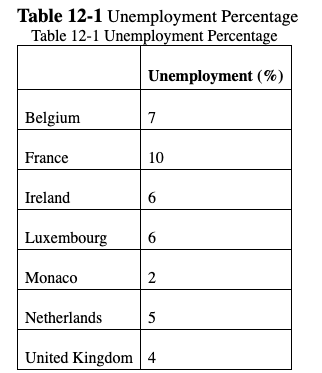
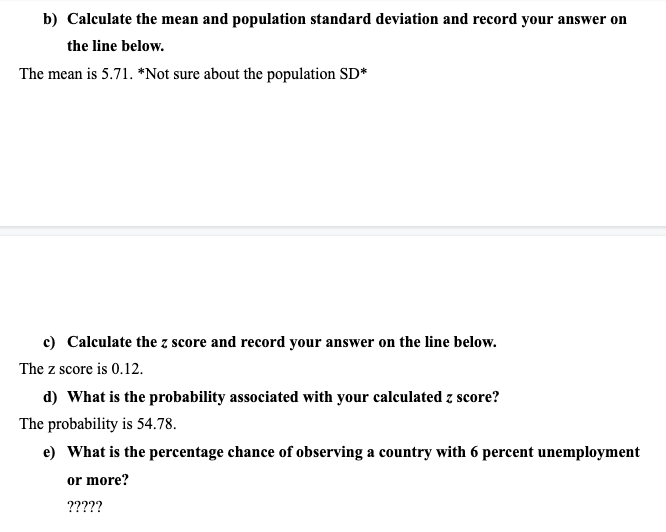
Compute a z score to determine the percentage chance of observing a country with 6 percent unemployment or more.
candycove:
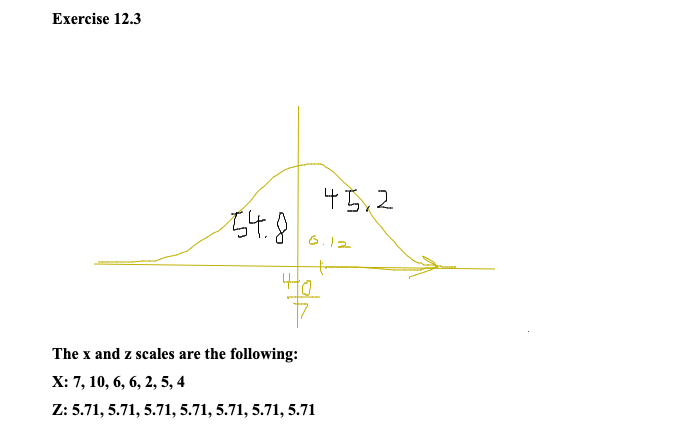
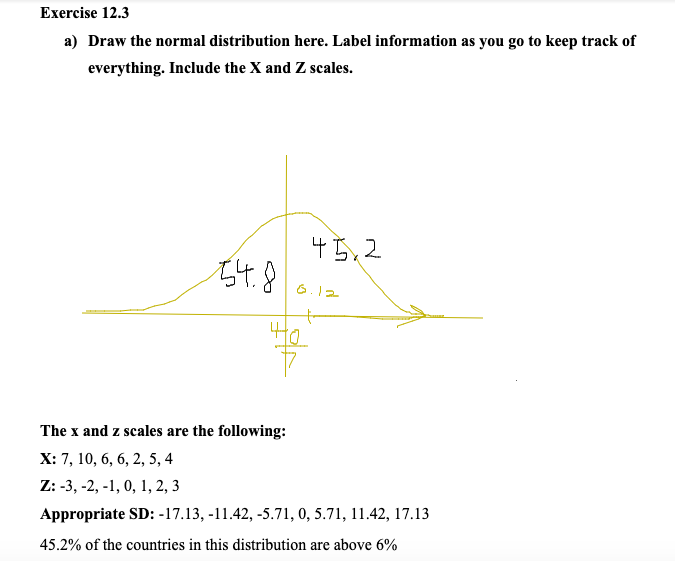
a) Draw the normal distribution here. Label information as you go to keep track of everything. Include the X and Z scales.
oof ight give me a sec
so u need the formula or nah
candycove:
Honestly, I don't know.
oh well i dont have statistics till nex semester sooo
but thats a mood lmao
candycove:
Thanks for trying.
well i didnt do anything tho but say idk tho
but ur welcome
candycove:
/:
i do appoligize tho
 Shadow:
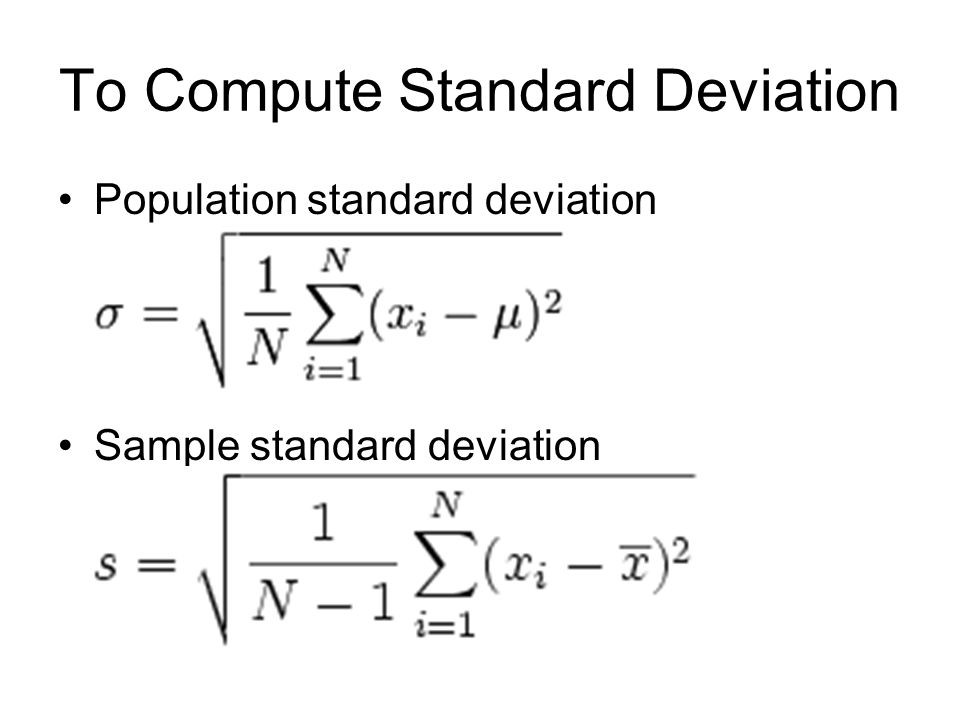
First calculate the mean percent. Then find the absolute value difference of each x value from the mean. Then square each, sum them. Then divide that that sum by n, or the number of x values. This gives you the standard deviation, which you can then input into this formula for the z-score \[z = \frac{ x_{i} - \mu}{ \sigma } \] Z score of 6% is equal to 6% - the mean, divided by the standard deviation Formula for mean: \[\mu = \frac{ \sum x }{ n }\] Formula for standard deviation: \[\sigma = \frac{ \sum D^2 }{ n }\]
Shadow:
Technically finding the absolute value difference doesn't matter (it's just how it's sometimes talked about when learning the concept). Just square each difference then sum them. That's sum D^2
Shadow:
Then once you calculate the z score, look at a z chart and find the z score. You're looking for the % that relates to the z-score.
candycove:
What the actual fück. Shadow, I don't understand jack about what you just said. I'm a senior in college majoring in Political Science and I haven't done math in 2 years. I'm losing my mind - just answer the question and stop playing with me.
Shadow:
lol
candycove:
Please, I've learned enough. Just answer the question. It's 3 AM and I want to sleep.
candycove:
Is the Z-score 6 meaning it is Luxembourg or Ireland? Or both?
Shadow:
hmm, I couldn't tell you
candycove:
SHADOW PLEASE
Shadow:
Oh I see what you mean now. 6% in the questions wording is just a random # they chose
candycove:
What? Why would they do that? Btw, the class isn't Statistics. It's Research Analysis in Political Science.
Shadow:
I have my own stuff to do. This stuff is all algebra. The mean is the average. 1, 2, 3 Average = (1 + 2 + 3)/3 You can do this entire problem in a calculator / Wolfram.
Shadow:
\[\sum \] just means sum. When it's next to x, it means add up all the x values as shown in the table.
candycove:
What are X and Z scales?
candycove:
Why would they mention 6 if it didn't matter?
candycove:
How do you find the normal distribution? (I've already asked Google).
Shadow:
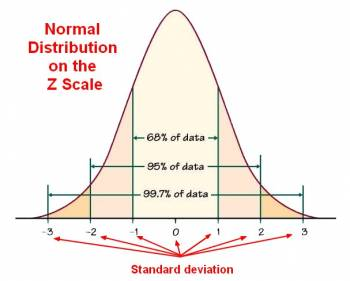
|dw:1602831233702:dw|
Shadow:
That's a normal distribution
Shadow:
Half the scores on one side, other half on the others
Shadow:
Average is in the center. Along the x -axis are the z scores which relate to percents.
Shadow:
You're looking for the z score that relates to 6% and the mean of this distribution along with the distributions standard deviation.
Shadow:
Once you calculate the z value you know if it's negative or not
candycove:
Okay, the question says "compute a z score to determine the percentage chance of observing a country with *6 percent* unemployment or more." Does that mean we are not counting Monaco, United Kingdom, Netherlands?
Shadow:
The average means you sum (add up) all the x values, that means the scores of all the countries
candycove:
Because one of the questions is "What is the percentage chance of observing a country with 6 percent unemployment or more?"
Shadow:
To get the average unemployment rate across those countries
Shadow:
Yeah is this due today?
candycove:
No but I need to finish this right now.
Shadow:
Statistics at 3am, you're definitely weird
candycove:
Please leave me alone. You don't understand.
candycove:
Do you know anyone that can actually help me?
Shadow:
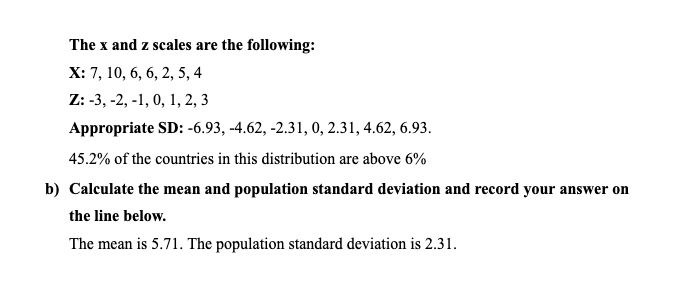
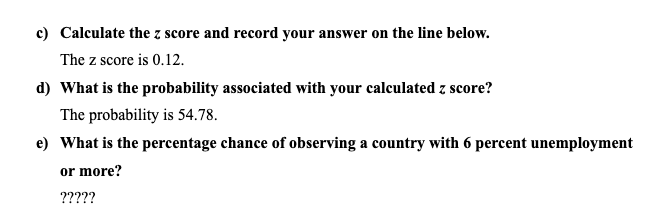
\[Average = \mu = \frac{ 7 + 10 + 6 + 6 + 2 + 5 + 4 }{ 7 } = \frac{ 40 }{ 7 } = 5.71\]
Shadow:
I know it's 3am for you but play nice (:
Shadow:
Next you basically take each x value and subtract the mean from it. This gives you the difference, or, how much it deviates away from the average.
candycove:
Nice? I'm livid right now. Imagine spending hours on this stupid asś question and still not understanding. I am a POLI SCI major for a reason.
candycove:
The x values are the countries, right?
Shadow:
Yes
Shadow:
Once you get the differences you square each of them -> x^2, then add them all up. This gives you \[\sum D^2\] Then you calculate the standard deviation using the formula I provided which is just basic inputs of sum D^2 /n
Shadow:
One small correction the formula should be: \[\sigma ^2 = \frac{ \sum D^2 }{ n }\]
Shadow:
Is this starting to make more sense / look doable
candycove:
So are we calculating the values less that 6 or not? Yes, it's starting to look doable. I'm subtracting right now.
Shadow:
We are. I see what you're thinking but I think it might make more sense once we get to the z score.
candycove:
Okay, I subtracted and I got the following: 1.29, 4.29, 0.29, 0.29, -3.71, -0.71, and -1.71.
Shadow:
I would keep them in fraction form. In cases like this decimal points matter and the fraction encompasses all the possible decimals.
Shadow:
It's a lot of grunt work, I know
candycove:
Fraction form? How do I find the fraction?
Shadow:
So I would do 7 - (40/7) in a calculator then use the fraction form of the result.
Shadow:
It's just to play it safe.
candycove:
Where did you get 40 from?
candycove:
Wait, never mind.
candycove:
I'm not getting fractions. I'm getting mixed fractions.
candycove:
Is that bad?
Shadow:
no, I'm getting them too
candycove:
Okay, thank you.
candycove:
Okay, I got 1 2/7, 4 2/7, 2/7, 2/7, -3 5/7, -5/7, and -1 5/7.
candycove:
Now, I'll be squaring those 7 values by 2, correct?
Shadow:
Yes
candycove:
I got 4/49 for the first one. Is that correct? I want to make sure before I do the rest.
Shadow:
The way I calculated my differences is x - 40/7 I got 9/7, 30/7, 2/7, 2/7, -26/7, -5/7, -12/7 Squared: 81/49, 900/49, 4/49, 4/49, 676/49, 25/49, 144/49 Summed: 262/7
candycove:
I used an online calculator because I couldn't find mine. Are you telling me it's wrong?
Shadow:
Take 4 2/7 4 is basically 4 7/7s, so 4 x 7 = 28 28 + 2 = 30 30/7
Shadow:
Same stuff
candycove:
Okay, cool but whose answers should we go with? Probably yours.
Shadow:
Lol
Shadow:
\[\sigma^2 = \frac{ \frac{ 262 }{ 7 } }{ 7 } = \frac{ 262 }{ 49 }\] \[\sigma = \sqrt ( \frac{ 262 }{ 49 })\]
Shadow:
Then we just input that into our z formula
Shadow:
\[z = \frac{ x - \mu }{ \sigma } = \frac{ 6 - \frac{ 40 }{ 7 } }{ \sqrt \frac{ 262 }{ 49 } }\]
candycove:
I thought the number 6 in the question didn't matter?
Shadow:
I just meant that they could've chosen any %
Shadow:
By the way your prof sucks. These numbers are hella ugly
Shadow:
I got sqrt 2/131 or 0.12356 We find that on a z chart
candycove:
I know he sucks. It's an online class so there are zero resources or lectures. It's horrendous. We're basically teaching ourselves this sh!t.
Shadow:
Wait seriously, no lectures?
Shadow:
The hell
candycove:
Idk how the others in class are doing it.
candycove:
Where do we find a z chart?
Shadow:
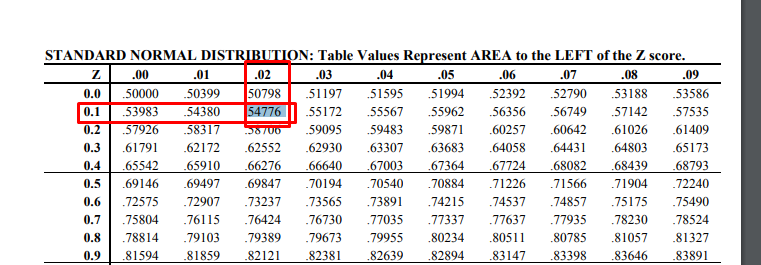
k I referred to a z chart and for 0.12 I got 0.54776 is to the left of the z score. Take 1 - 0.54776 and you have the % of scores in this distribution that are to the right of 6%
Shadow:
|dw:1602833937102:dw|
Shadow:
The column is the first decimal point, then the row is the second decimal point.
Shadow:
See how 'more than 6%' kind of makes sense now?
candycove:
Um, I can't find 0.12.
Shadow:
Look for 0.1 under z, then use the row to find 0.02, then find the intersection of that row and column value.
 Shadow:
I've had this concept taught to me in two different classes in lecture, and I can't imagine having to learn this on your own lmao
candycove:
Okay, I got 0.45224. What do I do with this value?
Shadow:
That's the %
Shadow:
Of scores in the distribution that are above that z value
Shadow:
Or % of countries that have an unemployment rate of 6% or higher
Shadow:
We needed all the countries including the ones below 6% to get a 'feel' for the distribution, to see how the scores were deviating. Then the formula is able to pinpoint what kind of z score 6% has in relation to the standard deviation and the mean.
candycove:
Okay. Thank you. To answer the question, do I have to draw an entire graph? Can I just say the normal distribution is 0.54776 and list the x and z scales.
Shadow:
I think sometimes in class, we'd draw the distribution, mark the z value, then shade in the %
Shadow:
Basically just another was of saying 'the % is greater than z = 0.12'
Shadow:
Also remember 0.45224 is the % you want to list
Shadow:
or 45.2%
Shadow:
54.8% is behind the z score
candycove:
What?
candycove:
But it's only asking for the normal distribution.
Shadow:
|dw:1602834659647:dw|
Shadow:
45.2% of the countries in this distribution are above 6%
candycove:
\(\color{#0cbb34}{\text{Originally Posted by}}\) @Shadow Created with RaphaëlReply Using Drawing \(\color{#0cbb34}{\text{End of Quote}}\) Okay, how about I attach your wonderful graph, list the x and z scales and include the normal distribution. That is more than what this professor deserves. Does that answer the question?
Shadow:
Sure, but what do you mean by 'normal distribution'
candycove:
The question says "draw the normal distribution here" so I'll say the normal distribution is 0.54776.
Shadow:
Yeah but that makes no sense
Shadow:
The graph I drew is the normal distribution
candycove:
But how will he know the normal distribution? Like the number?
Shadow:
54.8% is just the stuff left of the z score, not the normal distribution
candycove:
Okay, genius, what do you think I should answer then?
candycove:
Just attach your graph and mention the x and z scales? Will that answer the question?
Shadow:
The graph technically has the z value and the % which he's asking for, it's just kind of Evil hand-drawing. I'm not sure how he wants the graph represented but it's definitely readable in terms saying what the distribution of this question is.
candycove:
He deserves an evil hand-drawn graph. I hope he goes blind reading it.
Shadow:
I'm used to answering stat questions differently but honestly hope all your uni classes aren't like this.
Shadow:
Are you full online or something?
candycove:
They're not. This is the only awful class. It's a Poli Sci class so I don't think I need to be over-emphasize.
candycove:
All my classes are offered online so I didn't have a choice.
Shadow:
Didn't know Poli-Sci did stats. Almost majored in that too xD
candycove:
They don't! That's why I'm losing my mind. This is the first Poli Sci class that's putting me through this nightmare.
Shadow:
And I'm taking all online too. I just mean all of them provide actual lectures to watch. Having no resource but a textbook means you just paid for a textbook and hw. Not a professor.
candycove:
Don't even get me started on how we're being ripped off.
Shadow:
Lmao, okay. I'd pick your brain about poly sci but it's late for you.
candycove:
We don't even have classes where he explains the stuff.
candycove:
Sir, I have more questions to answer after this. You honestly think I'm done?
Shadow:
Cause I just can't imagine a QC/OS user doing poly sci
candycove:
Wait, why?
Shadow:
Think they'd all be business majors or other mainstream stuff. Not care about politics.
 candycove:
It's not just about politics but yeah, that's a major component.
Shadow:
What is 5.71
candycove:
The z value? AKA the mean?
candycove:
Does it have to be in fraction form again?
Shadow:
z value isn't the mean
candycove:
Yes, it is? Didn't we subtract the x and z values?
 Shadow:
Think he wants you to draw in the numbers below the x axis, as the z numbers.
Shadow:
Otherwise, idk what it's asking for
candycove:
If the standard deviation is 5.71, then what is the mean?
Shadow:
Actually I had that right. Write the z values -1, 1, etc on the graph. Then under each write the appropriate SD. So for 1 its 5.71 and 2 it's 2 times 5.71 = ? etc
Shadow:
It's all coming back to me now lol
candycove:
Dude, where are you getting the z values from?
 candycove:
Why did we subtract x and z (5.71) values if that's not even the z value?
Shadow:
5.71 is the average, not a z value
Shadow:
A z value of 5.71 would be in far right aka Africa
Shadow:
idk where you got that from but just write the z values as is shown in the image I lined, -3, -2, -1, 0, 1, 2, 3, then under them the appropriate standard deviations
Shadow:
Think that's what he's asking for.
Shadow:
Lol
candycove:
Okay, I just scrolled up and I think I'm hallucinating. You never said 5.71 was the z value. It's the mean.
Shadow:
Yeah I'm starting to hallucinate too at this point
candycove:
Africa sounds nice, maybe i'll die there and won't have to do this
Shadow:
lol
Shadow:
I genuinely laughed. I feel your pain. Unfortunately though we have to wrap this question up. I have my last minute online class procrastination stuff to do as well.
Shadow:
I can help you more tomorrow
candycove:
Glad you got a laugh out of my misery. Thank you for bearing with me. I appreciate it. I'll try to answer the other questions and send you a screenshot to make certain they are correct. Thank you, legend :D
Shadow:
You're welcome. Good luck with your classes.
 Shadow:
\(\color{#0cbb34}{\text{Originally Posted by}}\) @Shadow \[\sigma^2 = \frac{ \frac{ 262 }{ 7 } }{ 7 } = \frac{ 262 }{ 49 }\] \[\sigma = \sqrt ( \frac{ 262 }{ 49 })\] \(\color{#0cbb34}{\text{End of Quote}}\) Sigma is the standard deviation. This is my bad but what you did you 5.71 under the z scores should have been done to the SD. This is usually why I don't help late at night when my brain is dead xD My apologies. But that should allow you to put in the decimal form of sigma as SD or standard deviation, then e) is what we discussed before, 45.2%
candycove:
No idea what you just said.
Shadow:
Lol
candycove:
Do we know the population SD? There's a difference between a standard SD and a pop SD.
Shadow:
hmm you actually making sense ._.
candycove:
-_-
Shadow:
I think that's what we did find though
Shadow:
"Population standard deviation looks at the square root of the variance of the set of numbers."
candycove:
Why? It didn't specify to find the population SD.
Shadow:
\[\sigma ^2 = variance \rightarrow \sigma = SD\]
Shadow:
and \[\sigma = sigm@\]
candycove:
You're not making sense again.
candycove:
Which answers of mine are incorrect?
Shadow:
\[\sigma = \sqrt \frac{ 262 }{ 49 } = 2.31\] For z -3, -2, -1, 0, 1, 2, 3, the number under them should be this 2.31, so multiply 2.31 by -1, 1, 2, 3, etc. We did it for 5.71 but that was an error, as that was the mean.
 Shadow:
If that helps you visualize it, the z markers are under the x axis, and one standard deviation lies on z = 1, so we put 2.31 under it.
candycove:
\(\color{#0cbb34}{\text{Originally Posted by}}\) @Shadow Actually I had that right. Write the z values -1, 1, etc on the graph. Then under each write the appropriate SD. So for 1 its 5.71 and 2 it's 2 times 5.71 = ? etc \(\color{#0cbb34}{\text{End of Quote}}\) ????
Shadow:
Yeah I was hallucinating alongside you remember
Shadow:
Had some good sleep last night, now I see clearly now (:
candycove:
Where did you get 2.31 from? Also, what is the mean? I can't find it.
Shadow:
The mean is the average, aka 5.71, derived from: \(\color{#0cbb34}{\text{Originally Posted by}}\) @Shadow \[Average = \mu = \frac{ 7 + 10 + 6 + 6 + 2 + 5 + 4 }{ 7 } = \frac{ 40 }{ 7 } = 5.71\] \(\color{#0cbb34}{\text{End of Quote}}\)
candycove:
I thought that was the SD? Is it the same?
Shadow:
\[\sigma = \frac{ \sum D^2 }{ n }\] \[\sigma^2 = \frac{ \frac{ 262 }{ 7 } }{ 7 } = \frac{ 262 }{ 49 }\] \[\sigma = \sqrt ( \frac{ 262 }{ 49 })\] \[\sigma = 2.31\]
Shadow:
Remember when we added up the squared differences?
Shadow:
That's how we got to sum D^2, then to the variance sigma^2, then to sigma, which is the standard deviation
candycove:
Please stop confusing me. Why do we have two SD's now?
Shadow:
We don't. The only SD is 2.31
Shadow:
I just simplified it from its previous forms
Shadow:
5.71 is the mean aka the average
Shadow:
No
candycove:
Okay, got it.
candycove:
Were c and d correct?
Shadow:
Yes
Shadow:
I gotta go take this test, will be back in like 2hrs if you have more stats stuff.
 Shadow:
What you wrote just below appropriate SD is what you put for e
Shadow:
You can just put 45.2% though for e
Shadow:
\(\color{#0cbb34}{\text{Originally Posted by}}\) @candycove Okay, I got 0.45224. What do I do with this value? \(\color{#0cbb34}{\text{End of Quote}}\) Unless he wants it rounded to the second place, which is 45.22% but it's whatever his standard is.
candycove:
Ah, got it. Thank you so much. Don't you have a test?
 Shadow:
It does but I forget how to do this one. Real unfortunate because the process is rather fun.
Shadow:
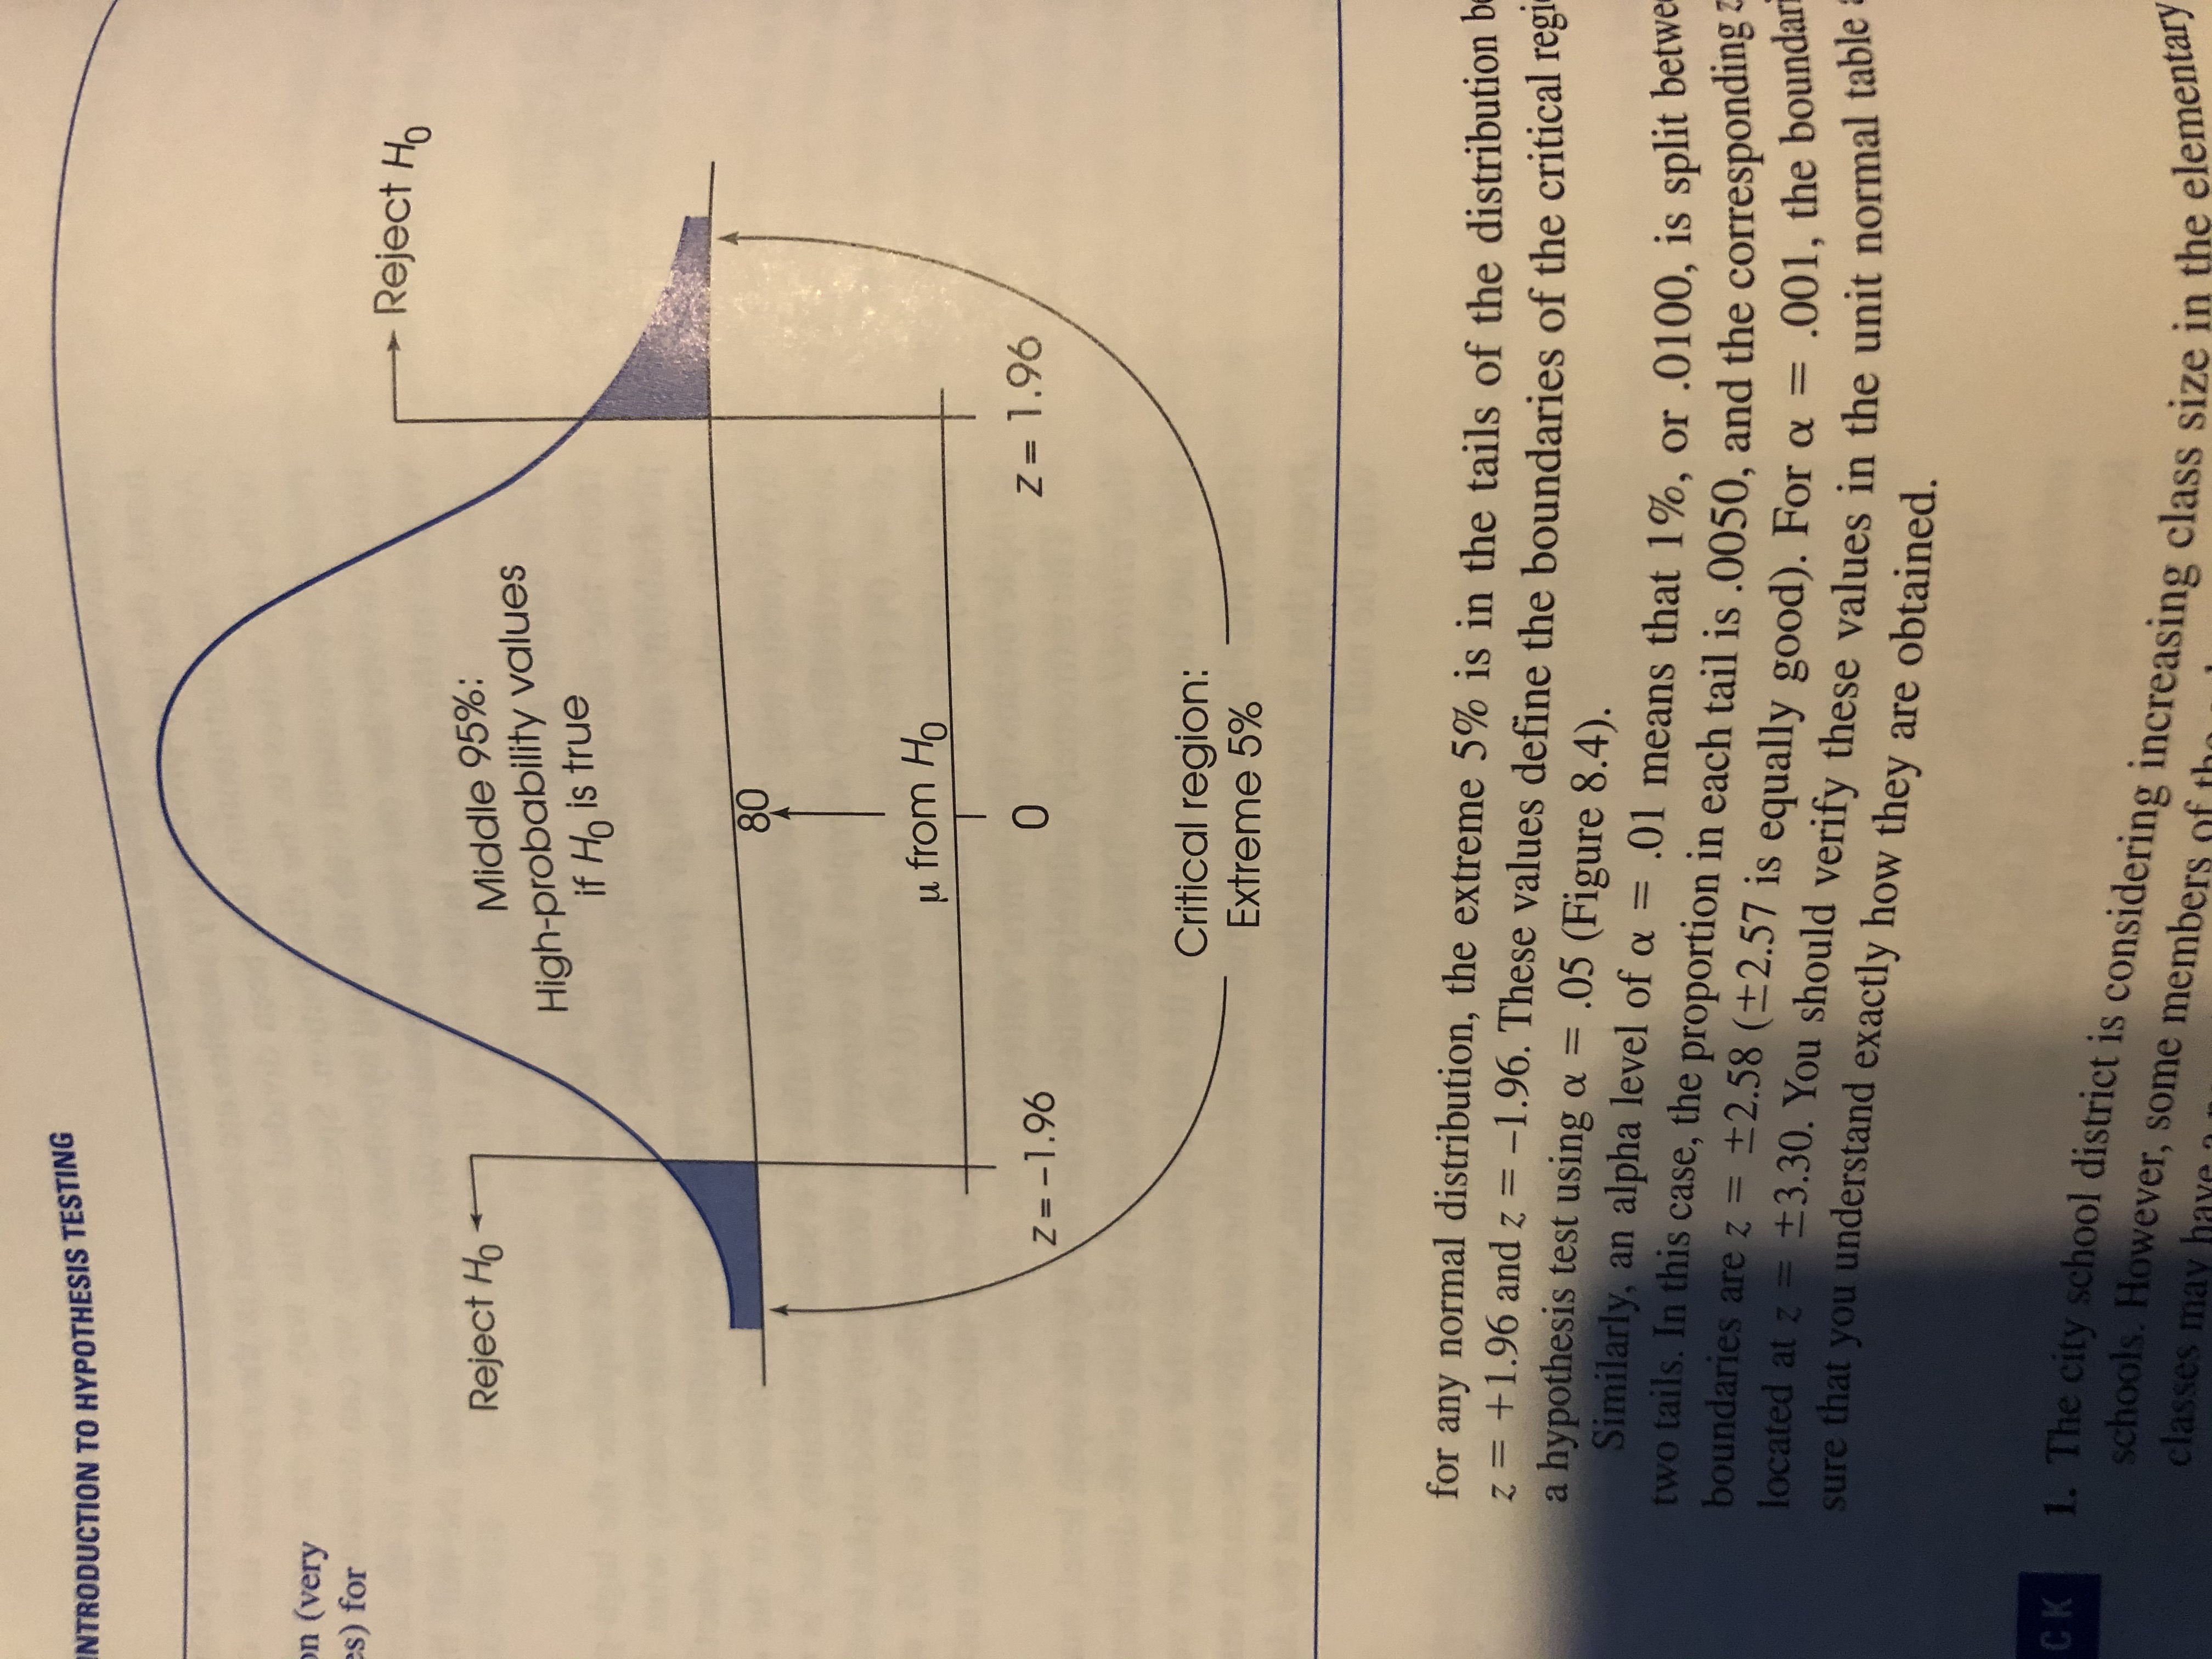
The gist of it is that you'd calculate a z score and if it's over z = +- 1.96 then it would fall in the last 5% on either end of the distribution, which means that you could reject the null hypothesis (h0 says that the hypothesis isn't true), so when you reject it, you're saying your hypothesis is correct. 5% is a number chosen in science because it's basically saying 'it's highly likely that we're solid with this hypothesis.'
Shadow:
I used plus or minus 1.96 as this problem is asking for a two tailed one
Shadow:
Okay here's clean definitions from my textbook: The null hypothesis (H0) basically says that there is no change, difference, or no relationship. The alternative hypothesis (H1) states that there is a change, a difference, or a relationship for the general population.
Shadow:
So for this question H0 and H1 would be: \[H_{0}: \mu = 23%\] \[H_{1}: \mu \neq 23% \]
Shadow:
So since this is two tailed, if we get a z score over either -1.96 or 1.96, we can reject H0 since it's statistically significant that it isn't 23%, and we accept the alternative hypothesis.
Shadow:
\[z = \frac{ M - \mu }{ \sigma_{M} }\] Where, m = the sample mean mu/mean/the average = the hypothesized population mean sigma_{m} = standard error between M and mu
Shadow:
We will use this to calculate the z score
Shadow:
\[\sigma_m = \frac{ \sigma }{ \sqrt n }\]
Shadow:
So for the standard error you need to calculate the standard deviation as we did in the first problem, then divided it by the sqrt of the n values, so n = 7 here
Shadow:
\[z = \frac{ M - \mu }{ \sigma_{M} }\] Where, m = the sample mean mu/mean/the average = the hypothesized population mean sigma_{m} = standard error between M and mu For this part, we're basically calculate the sample mean/average of the African countries, then subtracting 23% from it, then dividing it by the standard error which I explained above. Find the standard deviation again will be a long trip math wise if you remember, but this is all doable stuff. Hopefully I've listed out all the steps clearly. I think you can do it.
Shadow:
It looks intimidating but stuff like "use a two-tailed test" is literally just saying 'we care if it's negative or positive number.'
Shadow:
For the z score
candycove:
Feeling: stupid.
candycove:
The question is asking for a sample confidence interval so why are we calculating the z score?
Shadow:
I wouldn't worry about it. You haven't learned this concept and it's the kind of concept that you need to have done a couple times to be comfortable with.
candycove:
Are we looking for the sample SD or population SD?
Shadow:
The standard deviation of this sample
Shadow:
So we get sample mean, sum D^2, then SD of the sample. All the same stuff we did yesterday at 3am
 Shadow:
Jesus
 Shadow:
First lol
Shadow:
That reminds me, for one of those you have to do n-1...
candycove:
First one in the picture or my text?
candycove:
MY GOD I HATE MY LIFE
Shadow:
LOL
candycove:
WHAT IS N-1
candycove:
Wait, no. I don't want to know.
candycove:
Stop laughing at me ,
 candycove:
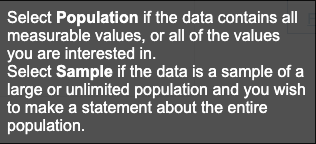
Okay, so population?
Shadow:
The stuff on the right is basically sum D^2, thing on the left is whether you divide by n or n-1
Shadow:
We're using sample. Population is only when you're calculating the entire population which is rarely possible.
Shadow:
It's like if you had all the Charizard pokemon cards and H0 is not damaged and H1 is damaged
Shadow:
Kind of irrelevant but I had to remember it for my sake.
candycove:
But we calculated the pop SD in the last question so it's not that rare.
candycove:
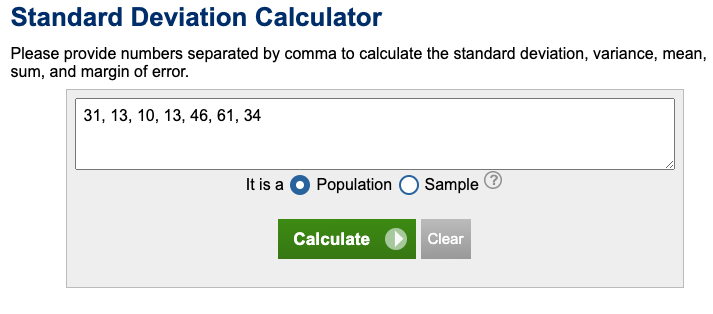
SD: 19.19?
candycove:
σ: 17.77?
Shadow:
That was fast.
candycove:
I used a calculator. Study smarter not harder.
candycove:
Which one is it?
Shadow:
Lol. If you used a calculator then you're probably right
Shadow:
or first
 Shadow:
lol
Shadow:
I mean it's just grunt work. You're really just showing you know what to do with the #s
candycove:
The what?
candycove:
Why are you mentioning new concepts to me. It's annoying.
Shadow:
I think we use sample SD formula here, because they specifically say "a sample of African countries'
candycove:
Okay, so s: 19.19 -- what's next?
Shadow:
standard error, then make sure you have the sample mean to, we're calculating the z score after.
Shadow:
Standard Error \[\sigma_m = \frac{ \sigma }{ \sqrt n }\]
candycove:
7.25624291383
Shadow:
Guess you used the fraction since I got 7.253 and I just used 19.19
candycove:
I used a calculator.
Shadow:
But now you just do (sample mean - 23%)/standard error
Shadow:
For the z score
candycove:
I don't know how to do it otherwise. :)
Shadow:
I mean I just inputted (19.19)/(sqrt7). Usually I like to keep the entire decimal or the fraction since sometimes 1.95 vs 1.96 can be the difference between rejecting a hypothesis or not.
candycove:
Is the sample mean 29.71?
Shadow:
I got the same
candycove:
0.925?
Shadow:
nvm
Shadow:
k so this means it didn't change statistically significantly and we reject our alternative hypothesis
 Shadow:
That imagine should express how it works to you, from my textbook.
candycove:
Did you get the same z score? I'm not sure if mine is correct.
Shadow:
I got the same.
Shadow:
So it would fall in the in the middle 90% of the graph and not in the 5% tips of the distribution
Shadow:
Actually im dumb, it's 5% because in a two tailed, it's 2.5% each, in a one tailed its 5% at the end.
candycove:
Okay but the question is asking for a confidence interval. Do we have one?
Shadow:
The confidence interval is alpla = 0.05, or the 5%, so it's the shaded region in the picture I uploaded.
Shadow:
alpha*
candycove:
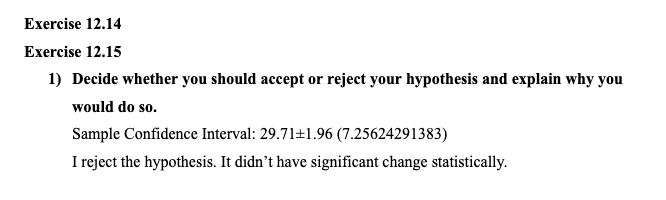
M = 5, 95% CI [4.82, 5.18] -- isn't that how a confidence interval is supposed to look like or does it not matter?
Shadow:
\[\mu \pm z \frac{ \sigma }{ \sqrt n}\]
Shadow:
or just \[\mu \pm z \sigma_{m}\]
candycove:
Okay, what does that look like for this question?
Shadow:
sample mean plus or minus z score times the standard error
candycove:
Dude no
Shadow:
?
candycove:
I mean, what is the confidence interval.
Shadow:
\[29.71 \pm 1.96 (7.25624291383)\]
Shadow:
I'd use the full standard error
 Shadow:
See how there's two numbers here: [4.82, 5.18] Do the math, mean plus z score of 1.96 times the standard error. Then do the same but minus. This will give you the two values for your brackets. Effectively these are the scores which would indicate a significant change statistically.
candycove:
Um ... why? The question was whether we accept or reject the hypothesis and we figured that out. So, do I have to do what you jut said?
Shadow:
The gist of it is that you'd calculate a z score and if it's over z = +- 1.96 then it would fall in the last 5% on either end of the distribution, which means that you could reject the null hypothesis (h0 says that the hypothesis isn't true), so when you reject it, you're saying your hypothesis is correct. 5% is a number chosen in science because it's basically saying 'it's highly likely that we're solid with this hypothesis.' The z score wasn't over 1.96 negative or positive so we're accepting H0 / rejecting H1 aka accepting the null hypothesis (that there wasn't a statistically significant change ).
candycove:
Reading this after two years and I truly recognize how unprofessional my professor was. He would not answer questions and relied on the TA for everything. It was so late and I was losing my mind when I asked this question! Shadow is a real one for helping me with this.
Join our real-time social learning platform and learn together with your friends!
 Bounty:
the world keeps moving fast and I'm stuck in a time lapse all I need is a minute
Bounty:
can I get so tips on how to start my journey into semi-realism art also on how to
Bounty:
the world keeps moving fast and I'm stuck in a time lapse all I need is a minute
Bounty:
can I get so tips on how to start my journey into semi-realism art also on how to
 Strawberryluna:
Read my poem. Im not for criticism its a poem I wrote after my breakup: Youu2019ll never understand the way you made me break, I hate that I still love you
Bounty:
first poem in a min- (tittle)? one moment i'm fine I smile till my face burns I laugh till I cant breath Then I cry I wonder where I went wrong I listen to
Strawberryluna:
Read my poem. Im not for criticism its a poem I wrote after my breakup: Youu2019ll never understand the way you made me break, I hate that I still love you
Bounty:
first poem in a min- (tittle)? one moment i'm fine I smile till my face burns I laugh till I cant breath Then I cry I wonder where I went wrong I listen to
 Twaylor:
3d printing a glider (for 150 pound 5'8 person - prolly should make it for up to
Twaylor:
3d printing a glider (for 150 pound 5'8 person - prolly should make it for up to
 cullenn:
pitter patter sound of rain gently tapping my window tonight. calming, soothing, right? not for me.
cullenn:
pitter patter sound of rain gently tapping my window tonight. calming, soothing, right? not for me.

 Arriyanalol:
DON'T BUY TICKETS TO SEAWORLD i watched a documentary on seaworld and its sad wha
Arriyanalol:
DON'T BUY TICKETS TO SEAWORLD i watched a documentary on seaworld and its sad wha
 natalieee:
who else wants a job in biology? I love biomedical science and want to work with
natalieee:
who else wants a job in biology? I love biomedical science and want to work with