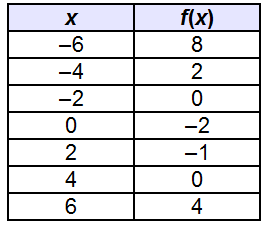
A 2-column table with 7 rows. The first column is labeled x with entries negative 6, negative 4, negative 2, 0, 2, 4, 6. The second column is labeled f of x with entries 8, 2, 0, negative 2, negative 1, 0, 4. Which is a possible turning point for the continuous function f(x)? (–2, 0) (0, –2) (2, –1) (4, 0)
What are your thoughts so far?
I have no clue
Let's look at the first two rows They tell us we have the points (-6,8) and (-4,2) What's going on with the y value when we go from y = 8 to y = 2? Is it going up or down?
Down?
yes
now look at the second and third row y values y = 2 y = 0 Is y going up or down?
down
yes, so the turning point is when y changes direction so when we go from down to up more technically: when we go from decreasing to increasing Example: |dw:1607369573964:dw| that's one example where we go from decreasing to increasing (but we could flip it around to get the same idea)
Thank you
let me know what you get as your answer
(–2, 0)
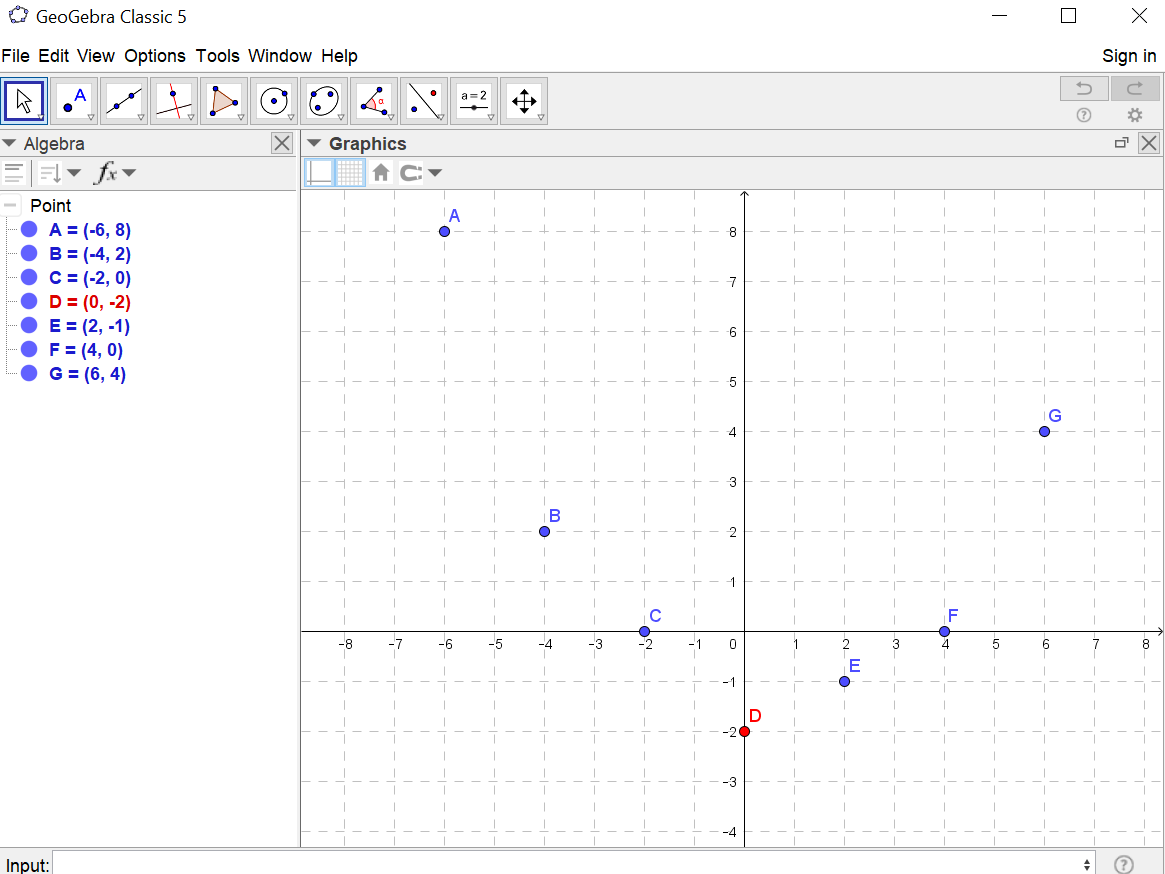
The points go downhill (moving left to right) but then change direction after the turning point
Thanks
No problem
(-2,0) is incorrect but you're fairly close
would it b (0, –2) then?

If you drew a curve through those points, it would likely turn at that red point
(0,-2) is correct
Thank you
No problem
Join our real-time social learning platform and learn together with your friends!
 natalieee:
who else wants a job in biology? I love biomedical science and want to work with
natalieee:
who else wants a job in biology? I love biomedical science and want to work with
 Twaylor:
Time flies doesn't it? I tried to not be the second squeaky wheel of the household and ended up hurting myself and others severely.
Twaylor:
Time flies doesn't it? I tried to not be the second squeaky wheel of the household and ended up hurting myself and others severely.
 clllaaaaaire:
any tips? the quality isn't the best because I am using this site on my computer
clllaaaaaire:
any tips? the quality isn't the best because I am using this site on my computer
 Midnight97:
Kinda a roleplay story between me and my friend enjoy... Part one Forgive me for all the screenshots.
Midnight97:
Kinda a roleplay story between me and my friend enjoy... Part one Forgive me for all the screenshots.
 StevenisGhost:
what type of song should I make next, and will y'all go check out my new song on
Midnight97:
My drawing sure changed over the years look at these two pictures from 2024 to no
StevenisGhost:
what type of song should I make next, and will y'all go check out my new song on
Midnight97:
My drawing sure changed over the years look at these two pictures from 2024 to no
 EdwinJsHispanic:
"poem" love is So Beautiful to have. But it's so hard to have. At this point I don't know whether its worth the wait Or if it's just millions of miles to re
EdwinJsHispanic:
"poem" love is So Beautiful to have. But it's so hard to have. At this point I don't know whether its worth the wait Or if it's just millions of miles to re
EdwinJsHispanic:
"poem" love is So Beautiful to have. But it's so hard to have. At this point I don't know whether its worth the wait Or if it's just millions of miles to re
EdwinJsHispanic:
"poem" love is So Beautiful to have. But it's so hard to have. At this point I don't know whether its worth the wait Or if it's just millions of miles to re