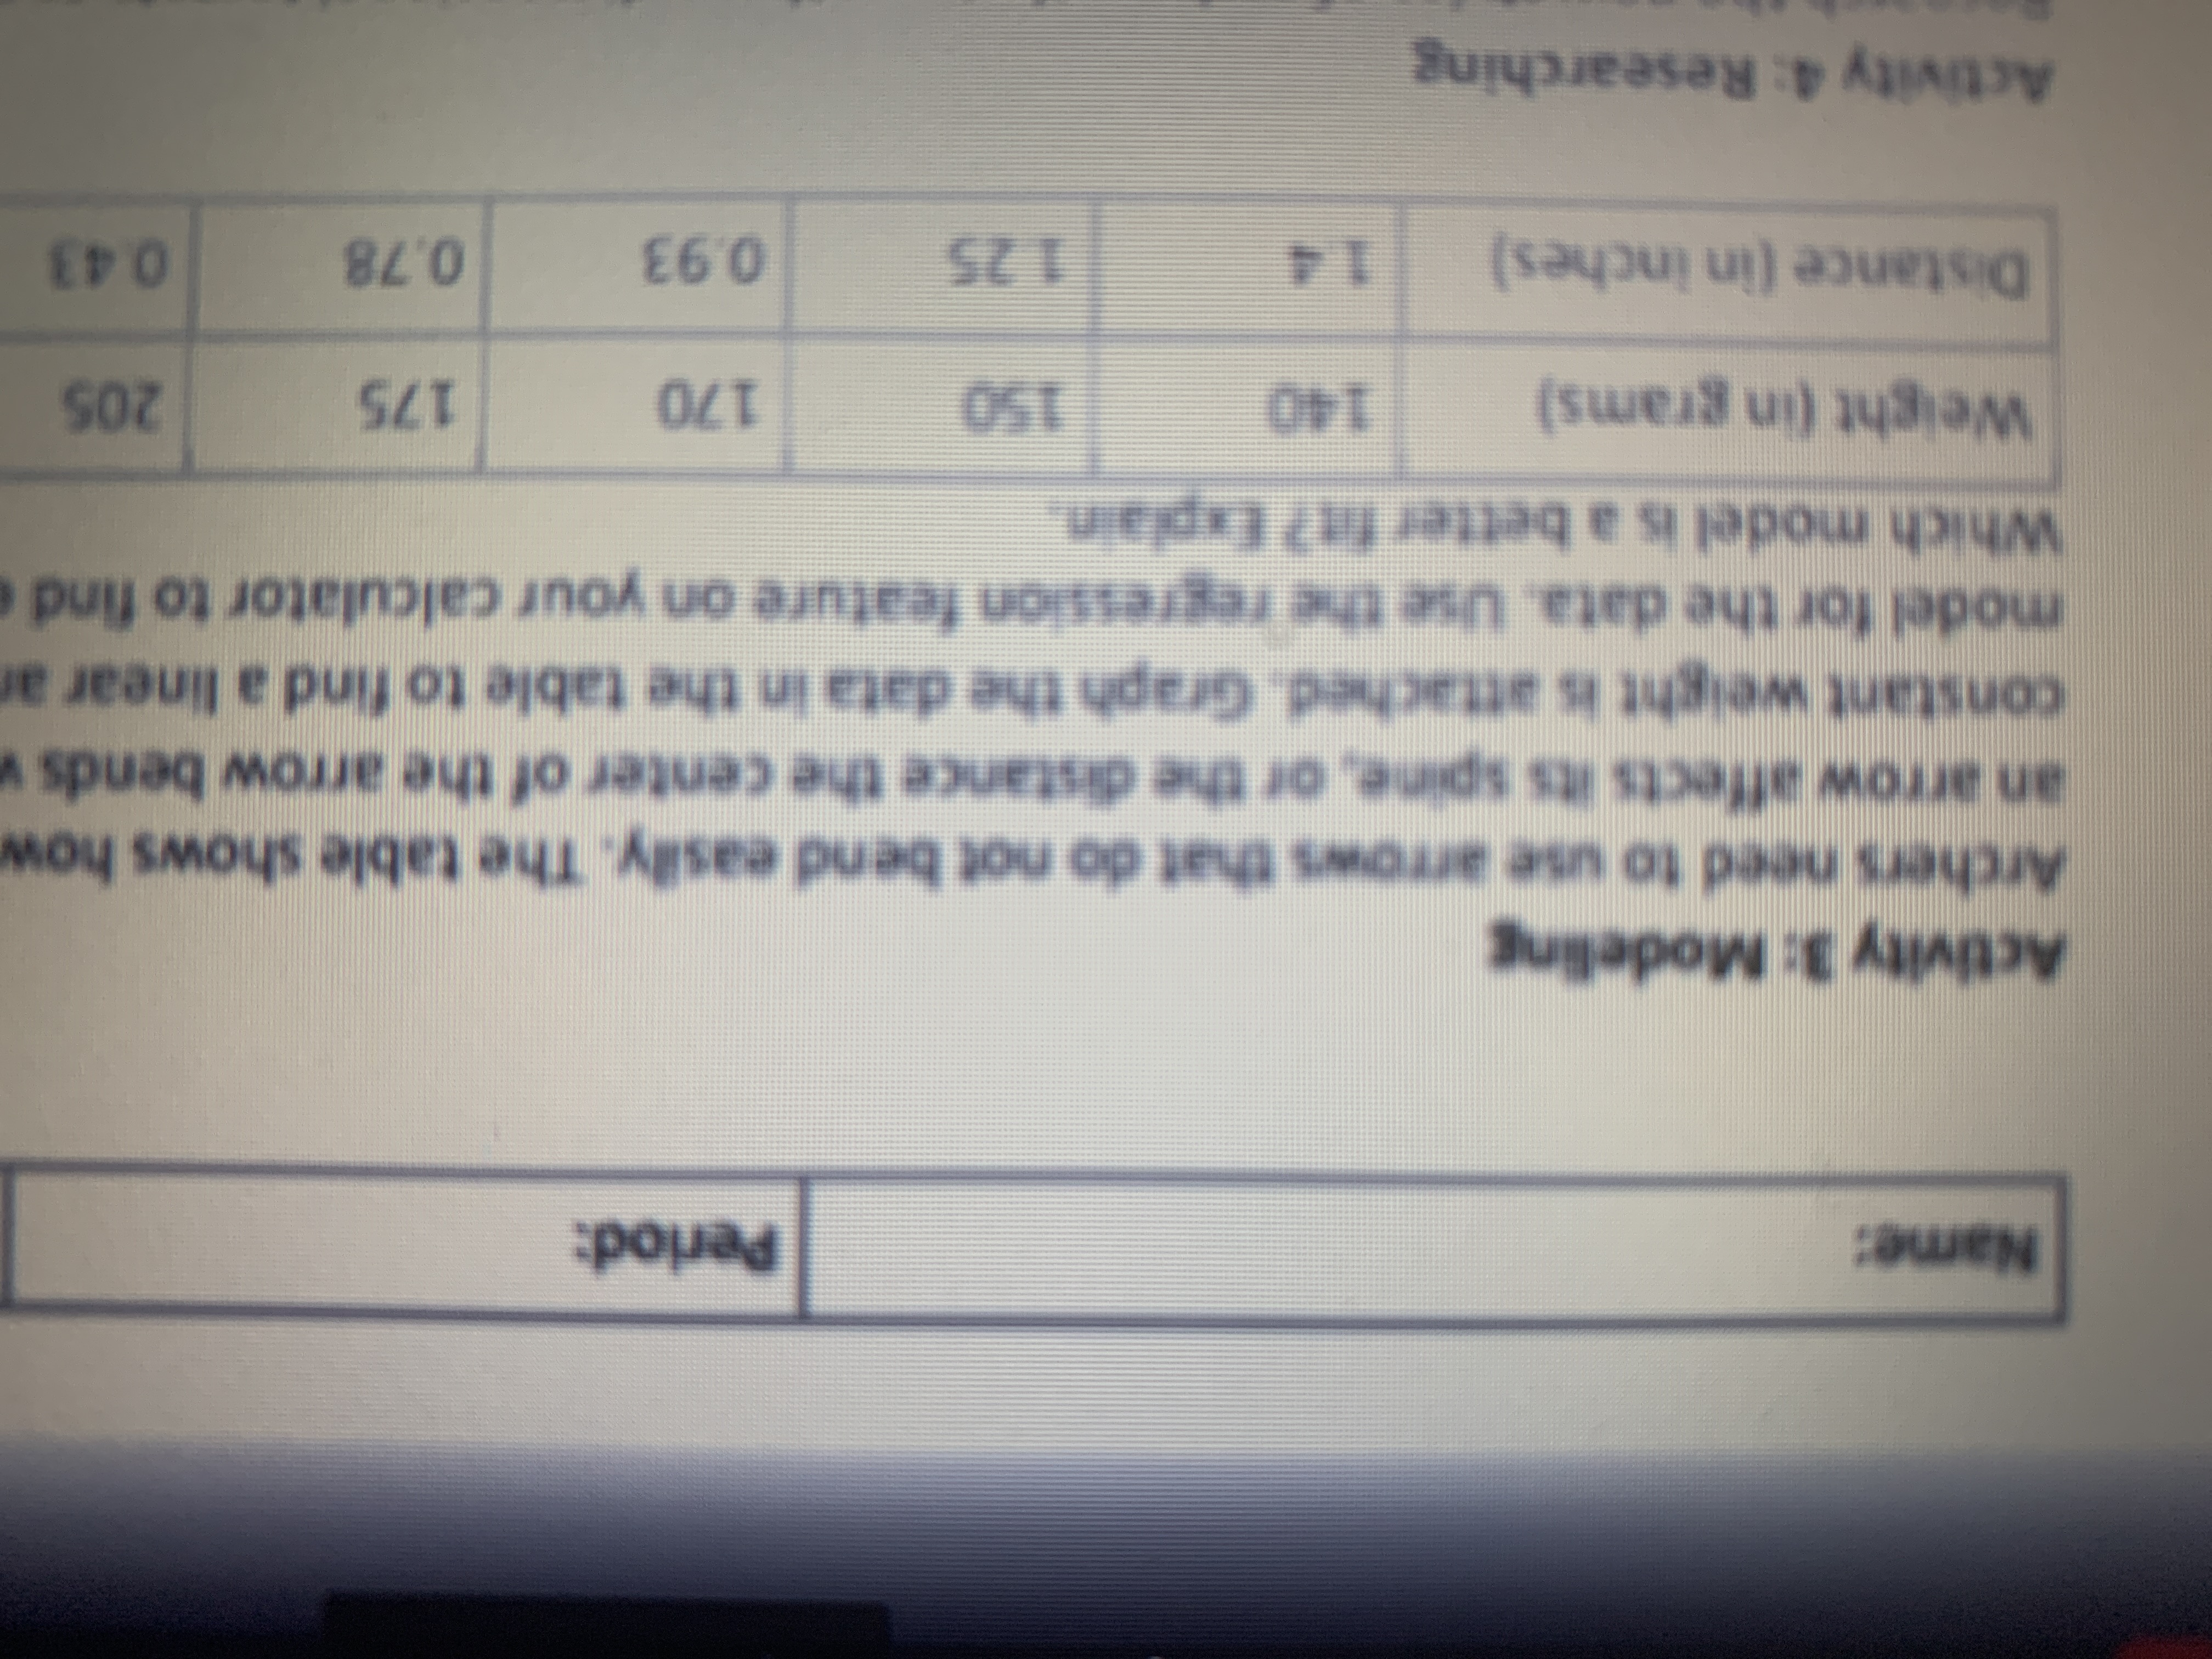
Archers need to use arrows that do not bend easily. The table shows how the weight of an arrow affects its spine, or the distance the center of the arrow bends when a certain constant weight is attached. Graph the data in the table to find a linear and a quadratic model for the data. Use the regression feature on your calculator to find each model. Which model is a better fit? Explain.
 Vocaloid:
We would need the data to fully answer this, but for each set: set the weight values as x, and the distance values as y graph the values and then use the regression model to make 1. a linear model and 2. an exponential model, and see which one gives you an r^2 value closer to 1
 Vocaloid:
good, so going along with what I said, you would plot (140, 1.4), (150, 1.25), etc. into your calculator, and calculate the r^2 values. if you're having trouble you can look up regression instructions for whatever calculator model you're using.
I put the numbers in my calculator and I got a=-0.15... b=3.5... but I don’t know how to find the quadratic
Vocaloid:
what brand/model of calculator are you using?
Ti 84 plus
Vocaloid:
try this: https://www.wsfcs.k12.nc.us/cms/lib/NC01001395/Centricity/Domain/1499/Quad%20Reg%20Calc%20Directions.pdf if that doesn't work, try this online regression calculator https://keisan.casio.com/exec/system/14059932254941
Ok I’m working on it now
Ok I got a=16.1966... b=-94.84... c=242.12
Vocaloid:
good, have you tried finding the r^2 values?
No how do I find them?
Vocaloid:
should be step 2? https://www.statology.org/quadratic-regression-ti-84-calculator/ stat --> calc --> linreg or quadreg, depending on which you're doing --> set your X as L1 and Y as L2 ---> calculate ---> enter
For some reason I only see a b c I don’t see r^2, I followed the instructions but I still don’t see it
Oh I fixed it for r^2 I got 0.99429...
Vocaloid:
alright, good, then repeat for the linear regression and see which one is higher I think this should work for linear regression r^2 https://ncalculators.com/statistics/r-squared-calculator.htm
Ok
I got -0.9941...
I’m not sure if that’s correct
Vocaloid:
hm, I don't think r should be negative can you send me your data points?
Vocaloid:
just typed out is fine
Ok
(140,1.4) (150.1.25)(170, 0.93)(175, 0.78)(205,0.43)
Vocaloid:
alright, so using https://ncalculators.com/statistics/r-squared-calculator.htm inputting x-values: 140, 150, 170, 175, 205 inputting y-values: 1.4, 1.25, 0.93, 0.78, 0.43 gives R^2 = 0.9729
Vocaloid:
so our quadratic model: R^2 = 0.99429 linear model: R^2 = 0.9729 since the quadratic model R^2 is closer to 1, this means the quadratic model is a better fit to the data
Ohhhhh wow, I was definitely confused until I got help...so thank you so much
Join our real-time social learning platform and learn together with your friends!
 natalieee:
who else wants a job in biology? I love biomedical science and want to work with
natalieee:
who else wants a job in biology? I love biomedical science and want to work with
 Twaylor:
Time flies doesn't it? I tried to not be the second squeaky wheel of the household and ended up hurting myself and others severely.
Twaylor:
Time flies doesn't it? I tried to not be the second squeaky wheel of the household and ended up hurting myself and others severely.
 clllaaaaaire:
any tips? the quality isn't the best because I am using this site on my computer
clllaaaaaire:
any tips? the quality isn't the best because I am using this site on my computer
 Midnight97:
Kinda a roleplay story between me and my friend enjoy... Part one Forgive me for all the screenshots.
Midnight97:
Kinda a roleplay story between me and my friend enjoy... Part one Forgive me for all the screenshots.
 StevenisGhost:
what type of song should I make next, and will y'all go check out my new song on
Midnight97:
My drawing sure changed over the years look at these two pictures from 2024 to no
StevenisGhost:
what type of song should I make next, and will y'all go check out my new song on
Midnight97:
My drawing sure changed over the years look at these two pictures from 2024 to no
 EdwinJsHispanic:
"poem" love is So Beautiful to have. But it's so hard to have. At this point I don't know whether its worth the wait Or if it's just millions of miles to re
EdwinJsHispanic:
"poem" love is So Beautiful to have. But it's so hard to have. At this point I don't know whether its worth the wait Or if it's just millions of miles to re
EdwinJsHispanic:
"poem" love is So Beautiful to have. But it's so hard to have. At this point I don't know whether its worth the wait Or if it's just millions of miles to re
EdwinJsHispanic:
"poem" love is So Beautiful to have. But it's so hard to have. At this point I don't know whether its worth the wait Or if it's just millions of miles to re