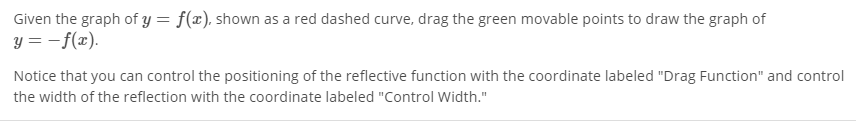
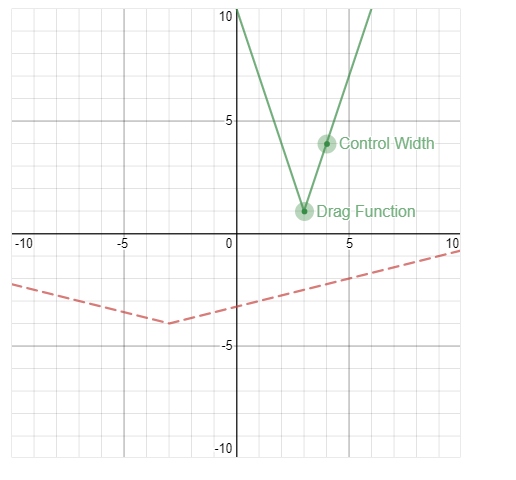
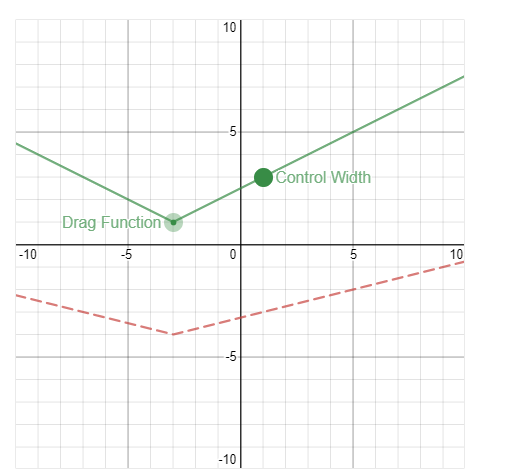
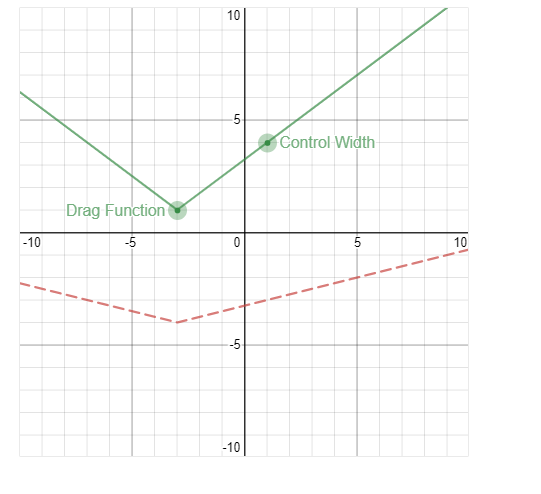
math problem
 Serenity1jacksonsl:
ok let me help you
 AZ:
AZ:
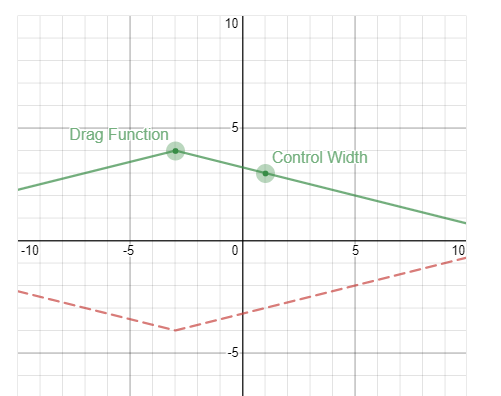
@iuytyuioiuytyuiop if you have a graph of f(x) the graph of -f(x) is going to be a reflection along the x-axis so basically, at each x-value, the y-value will become opposite so if at x = 1, the y-value of the line was -2 then for the graph of -f(x) the y-value would be +2 the x-value stays the same, but the y-value will switch signs
the x value is?
AZ:
it's the graph they gave you the red dashed lines any x-value on that graph the -f(x) function will a y-value with the opposite sign
 AZ:
AZ:
whatever the y-value is, just change the sign so on the graph you have when x = 1, you get y = -3 so that means on your new graph of -f(x) when x = -3 then y = \(\bf +3\) and do that for a few different points and then draw your new line
 AZ:
AZ:
are you sure? when x = -3 what is the y-value? so then flip the sign for it that's going to be another point on your line
 AZ:
AZ:
you didn't change anything did you? look when x = 1 what is the y-value on the red dotted line? what is the y-value when x = -3 what is the y-value when x = -7??
Serenity1jacksonsl:
who gave me a medal
Serenity1jacksonsl:
thc smackszzzz
i changed it to y= 4
AZ:
send the new graph then where you have x = 1, y = 3 x = -3, y= 4
@AZ
AZ:
That is correct :)
Join our real-time social learning platform and learn together with your friends!
 Twaylor:
Time flies doesn't it? I tried to not be the second squeaky wheel of the household and ended up hurting myself and others severely.
Twaylor:
Time flies doesn't it? I tried to not be the second squeaky wheel of the household and ended up hurting myself and others severely.
 clllaaaaaire:
any tips? the quality isn't the best because I am using this site on my computer
clllaaaaaire:
any tips? the quality isn't the best because I am using this site on my computer
 Midnight97:
Kinda a roleplay story between me and my friend enjoy... Part one Forgive me for all the screenshots.
Midnight97:
Kinda a roleplay story between me and my friend enjoy... Part one Forgive me for all the screenshots.
 StevenisGhost:
what type of song should I make next, and will y'all go check out my new song on
Midnight97:
My drawing sure changed over the years look at these two pictures from 2024 to no
StevenisGhost:
what type of song should I make next, and will y'all go check out my new song on
Midnight97:
My drawing sure changed over the years look at these two pictures from 2024 to no
 EdwinJsHispanic:
"poem" love is So Beautiful to have. But it's so hard to have. At this point I don't know whether its worth the wait Or if it's just millions of miles to re
EdwinJsHispanic:
"poem" love is So Beautiful to have. But it's so hard to have. At this point I don't know whether its worth the wait Or if it's just millions of miles to re
EdwinJsHispanic:
"poem" love is So Beautiful to have. But it's so hard to have. At this point I don't know whether its worth the wait Or if it's just millions of miles to re
EdwinJsHispanic:
"poem" love is So Beautiful to have. But it's so hard to have. At this point I don't know whether its worth the wait Or if it's just millions of miles to re
 Breathless:
I don't know if this would be considered art, but its close enough I believe, Any
Breathless:
I don't know if this would be considered art, but its close enough I believe, Any