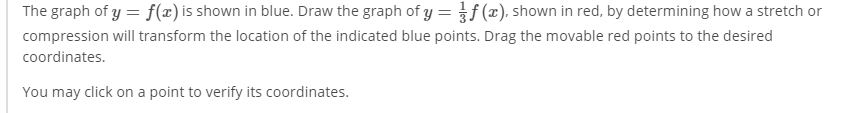
math problem
@AZ
 AZ:
AZ:
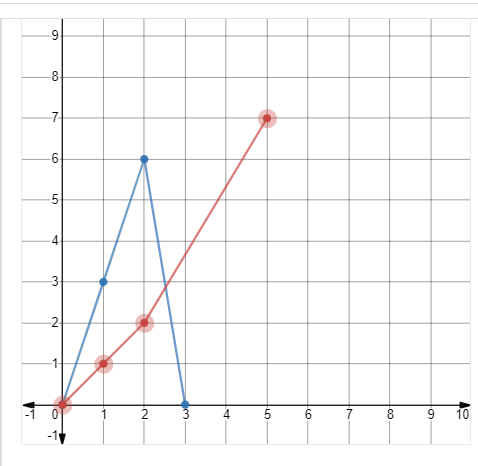
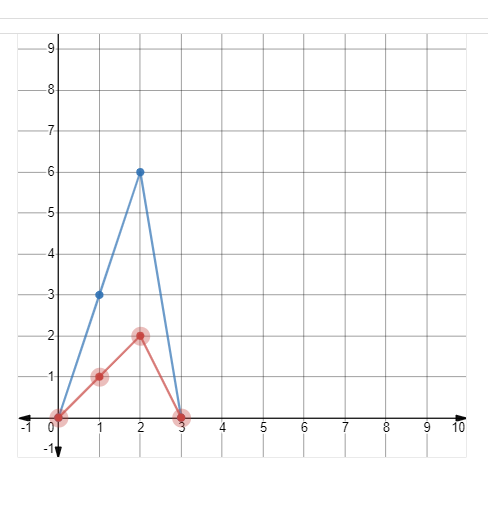
so our original blue graph is f(x) our new red graph is 1/3 f(x) that means whatever the y-value is, we divide by 3 so on the original blue graph, when x = 1, what is the y-value? then divide that y-value by 3 and that will be the y-value for the new red line when x = 1
AZ:
do the same thing for when x = 0 and when x = 2 and x = 3
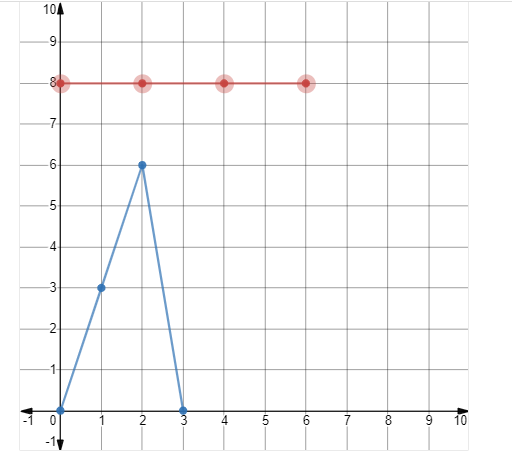
y value is 1
AZ:
yes, so that's for when x = 1 so move one of your red dots to (1, 1) now when x = 0, what is the y-value on the blue line? then divide that by 3 and that's the new y-value for the red line when x = 0
the y value is 0?
AZ:
yes now what about when x = 2 what will be the y-value for our new red line
az?
az
az?
AZ:
uh why'd you move two of the red dots to (0, 0) only move one of them
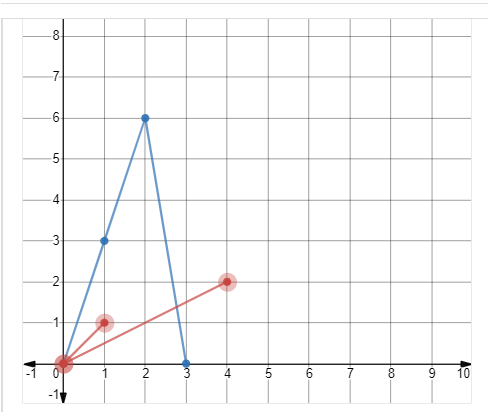
x=3 the y value is 0?
AZ:
yes and what about when x = 2
6
AZ:
and divide by 3 so that way you get the new y-value
2
AZ:
yes so plot that (2, 2)
thanks
AZ:
Good job!
Join our real-time social learning platform and learn together with your friends!
 Twaylor:
Time flies doesn't it? I tried to not be the second squeaky wheel of the household and ended up hurting myself and others severely.
Twaylor:
Time flies doesn't it? I tried to not be the second squeaky wheel of the household and ended up hurting myself and others severely.
 clllaaaaaire:
any tips? the quality isn't the best because I am using this site on my computer
clllaaaaaire:
any tips? the quality isn't the best because I am using this site on my computer
 Midnight97:
Kinda a roleplay story between me and my friend enjoy... Part one Forgive me for all the screenshots.
Midnight97:
Kinda a roleplay story between me and my friend enjoy... Part one Forgive me for all the screenshots.
 StevenisGhost:
what type of song should I make next, and will y'all go check out my new song on
Midnight97:
My drawing sure changed over the years look at these two pictures from 2024 to no
StevenisGhost:
what type of song should I make next, and will y'all go check out my new song on
Midnight97:
My drawing sure changed over the years look at these two pictures from 2024 to no
 EdwinJsHispanic:
"poem" love is So Beautiful to have. But it's so hard to have. At this point I don't know whether its worth the wait Or if it's just millions of miles to re
EdwinJsHispanic:
"poem" love is So Beautiful to have. But it's so hard to have. At this point I don't know whether its worth the wait Or if it's just millions of miles to re
EdwinJsHispanic:
"poem" love is So Beautiful to have. But it's so hard to have. At this point I don't know whether its worth the wait Or if it's just millions of miles to re
EdwinJsHispanic:
"poem" love is So Beautiful to have. But it's so hard to have. At this point I don't know whether its worth the wait Or if it's just millions of miles to re
 Breathless:
I don't know if this would be considered art, but its close enough I believe, Any
Breathless:
I don't know if this would be considered art, but its close enough I believe, Any