 Someoneee:
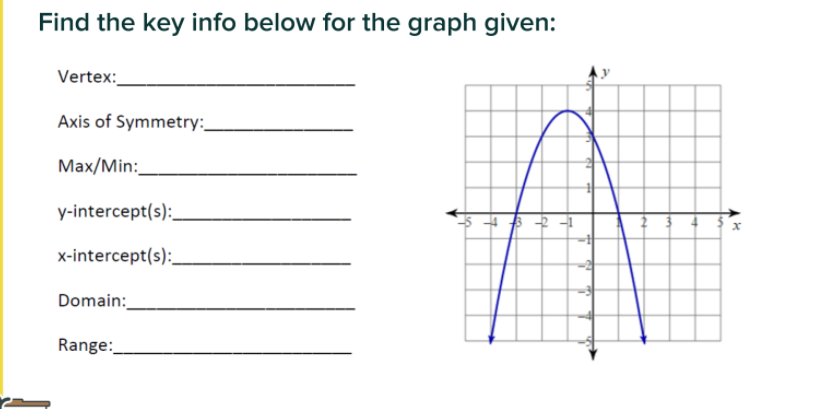
SS is in comments
 Someoneee:
im going to need help finding each one of them
 AZ:
AZ:
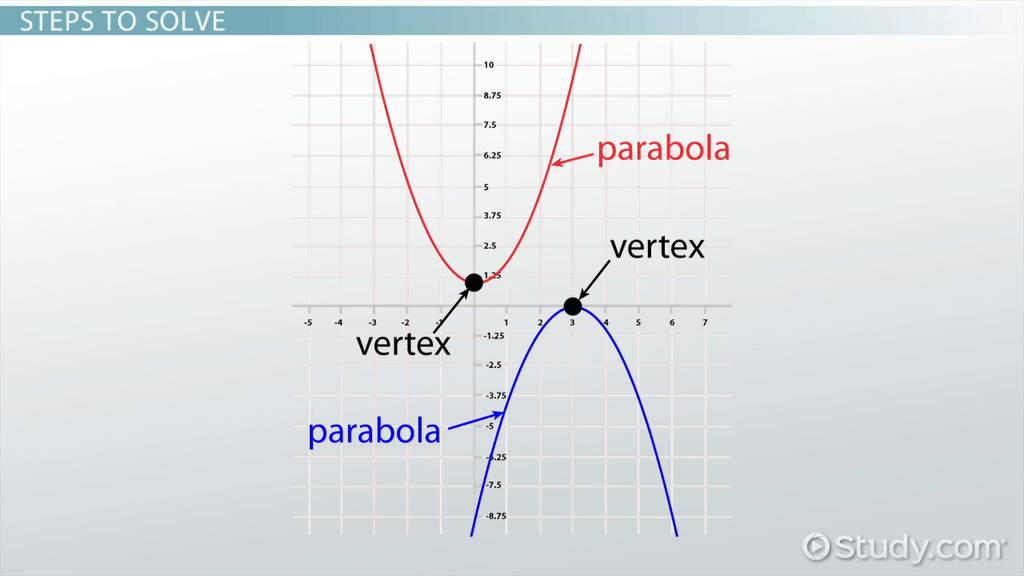
The vertex is the tip part of the parabola so look at your image, what is that point where the vertex is at
 Someoneee:
-1,4
AZ:
Exactly! The axis of symmetry is basically written in the form x = some number and that number is the x-value of the vertex what is the x-value of the vertex? so then how would you write the axis of symmetry
AZ:
the axis of symmetry is basically going to be a vertical line that splits the graph in two equal halves
Someoneee:
X= -1?
AZ:
Exactly! and now the max/min when you have a graph like this, the vertex is going to be the maximum |dw:1617982246866:dw| so what is the maximum?
Someoneee:
4
AZ:
and this is just in case you have more similar questions, if you graph looked like this then the vertex would be the MINUMUM |dw:1617982304678:dw|
AZ:
\(\color{#0cbb34}{\text{Originally Posted by}}\) @Someoneee 4 \(\color{#0cbb34}{\text{End of Quote}}\) No, write it as a point basically the answer is the same as the vertex
Someoneee:
(-1,4)
Someoneee:
or would it be (4,-4)?
Someoneee:
I don't know the range, so I don't know what the minimum would be
AZ:
\(\color{#0cbb34}{\text{Originally Posted by}}\) @Someoneee (-1,4) \(\color{#0cbb34}{\text{End of Quote}}\) yes, this is the maximum point
AZ:
this graph doesn't have a minimum because it keeps going on to negative infinity
Someoneee:
oh, ok
Someoneee:
y=3, and x=-3 or 1?
AZ:
\(\color{#0cbb34}{\text{Originally Posted by}}\) @Someoneee y=3, and x=-3 or 1? \(\color{#0cbb34}{\text{End of Quote}}\) which one is which? and can you write them as points
Someoneee:
y is (0,3) x is (-1,0)?
AZ:
the x-intercept is the points where the graph crosses the x-axis so when y = 0 the y-intercept is where the graph crosses the y-axis so when x = 0 what are the x and y intercepts?
AZ:
\(\color{#0cbb34}{\text{Originally Posted by}}\) @Someoneee y is (0,3) x is (-1,0)? \(\color{#0cbb34}{\text{End of Quote}}\) good but you're missing one more x-intercept
Someoneee:
oh, x would be either (1,0) or (-3,0)
AZ:
oh you got the x-intercept wrong \(\color{#0cbb34}{\text{Originally Posted by}}\) @Someoneee oh, x would be either (1,0) or (-3,0) \(\color{#0cbb34}{\text{End of Quote}}\) yup, those are your two x-intercepts
Someoneee:
So how do I find the domain now?
 Someoneee:
-3, -1, 1
 Someoneee:
yea
AZ:
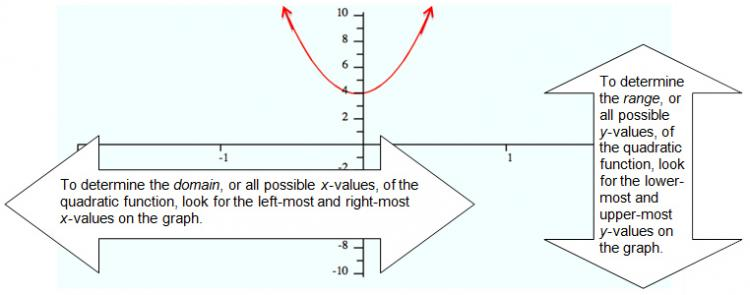
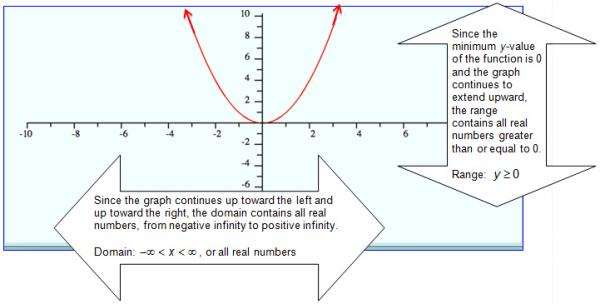
^That's just an example to help you see usually the domain is just all real numbers and the range is determined by the max/min
Someoneee:
so the range would be -1,4?
AZ:
No, that's not how you write domain and range domain is all the possible x-values range is all the possible y-values (-1, 4) is just a point It tells you that the maximum y-value is 4 and when you look at the graph, you see that the graph keeps going down and down and so the possible y-values is all the way from negative inifnity to 4 does that make sense?
Someoneee:
Yes
Someoneee:
what would I write as the range then?
AZ:
It depends on how they expect you to write it have you learned interval notation?
Someoneee:
No
AZ:
Then write it as an inequality You can see that graph I sent earlier as an example for the domain but for range, how would you write it? the possible y-values are any number less than or equal to 4 what is that as an inequality?
Join our real-time social learning platform and learn together with your friends!
 natalieee:
who else wants a job in biology? I love biomedical science and want to work with
natalieee:
who else wants a job in biology? I love biomedical science and want to work with
 Twaylor:
Time flies doesn't it? I tried to not be the second squeaky wheel of the household and ended up hurting myself and others severely.
Twaylor:
Time flies doesn't it? I tried to not be the second squeaky wheel of the household and ended up hurting myself and others severely.
 clllaaaaaire:
any tips? the quality isn't the best because I am using this site on my computer
clllaaaaaire:
any tips? the quality isn't the best because I am using this site on my computer
 Midnight97:
Kinda a roleplay story between me and my friend enjoy... Part one Forgive me for all the screenshots.
Midnight97:
Kinda a roleplay story between me and my friend enjoy... Part one Forgive me for all the screenshots.
 StevenisGhost:
what type of song should I make next, and will y'all go check out my new song on
Midnight97:
My drawing sure changed over the years look at these two pictures from 2024 to no
StevenisGhost:
what type of song should I make next, and will y'all go check out my new song on
Midnight97:
My drawing sure changed over the years look at these two pictures from 2024 to no
 EdwinJsHispanic:
"poem" love is So Beautiful to have. But it's so hard to have. At this point I don't know whether its worth the wait Or if it's just millions of miles to re
EdwinJsHispanic:
"poem" love is So Beautiful to have. But it's so hard to have. At this point I don't know whether its worth the wait Or if it's just millions of miles to re
EdwinJsHispanic:
"poem" love is So Beautiful to have. But it's so hard to have. At this point I don't know whether its worth the wait Or if it's just millions of miles to re
EdwinJsHispanic:
"poem" love is So Beautiful to have. But it's so hard to have. At this point I don't know whether its worth the wait Or if it's just millions of miles to re