 Rylee88:
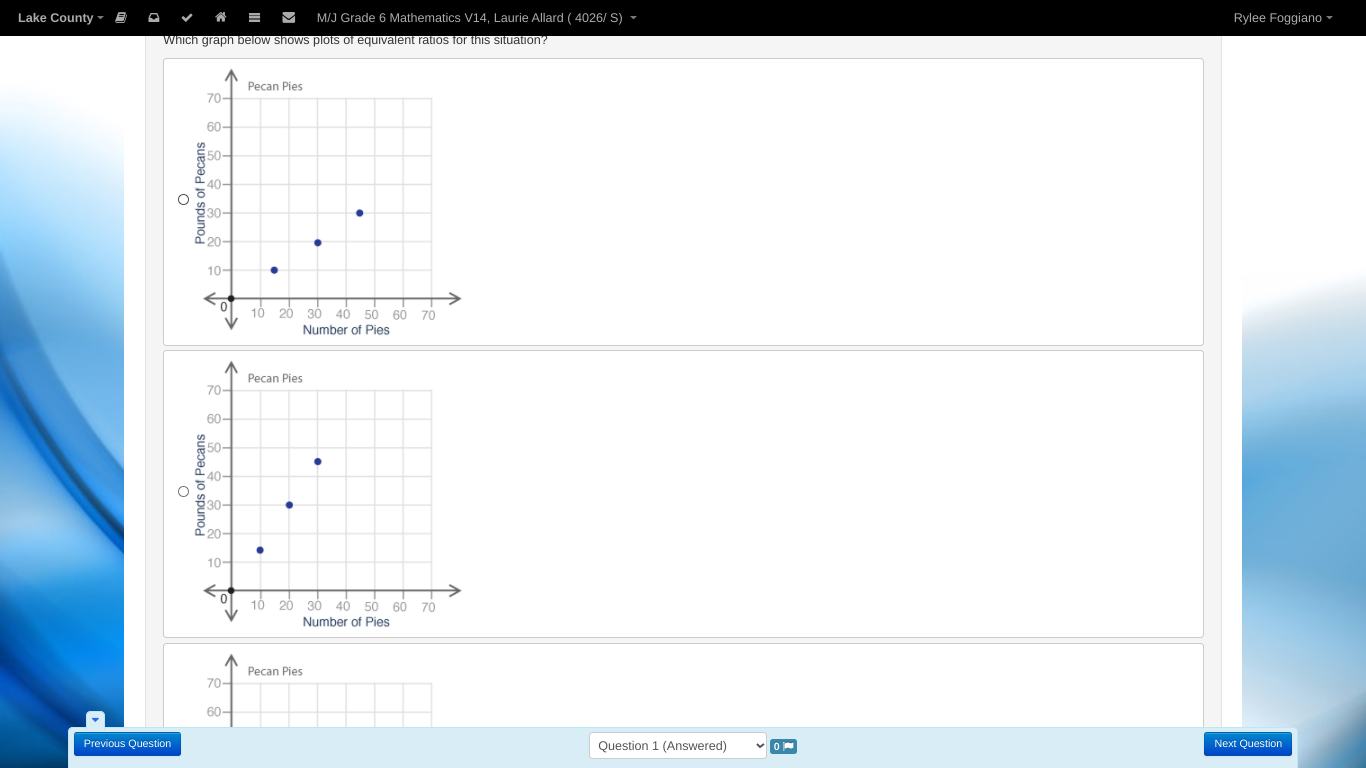
The table shows the relationship of how many pounds of pecans are needed to make a certain number of pies: Number of Pies 3 6 9 Pounds of Pecans 2 4 6 Which graph below shows plots of equivalent ratios for this situation?
 new2luv:
where is the graphs
 NotInsyncYT:
|dw:1618592716562:dw| Alright, I think I drew the graph correctly, this should help you.
Rylee88:
Uh huh
NotInsyncYT:
Erase that second photo, those are incorrect.
Rylee88:
? ok
NotInsyncYT:
no
Rylee88:
?
NotInsyncYT:
Not both.
NotInsyncYT:
Just that second one.
 NotInsyncYT:
There.
Rylee88:
O
NotInsyncYT:
So, we can see that, it's between these two correct?
Rylee88:
Yes
NotInsyncYT:
\[(x+2)(y+3)\] Now, using my chart I drew add until you get (x=10) and see what your value for your y-value is...
Rylee88:
2 more 2s
NotInsyncYT:
|dw:1618593117582:dw|
Rylee88:
8 10
NotInsyncYT:
correct. |dw:1618593138012:dw|
Rylee88:
Yea
NotInsyncYT:
Now, using the graphs 10 pounds of pecans makes 15 pies, which one is at (10,15)
Rylee88:
The last one
NotInsyncYT:
First or second one?
Rylee88:
Second?
NotInsyncYT:
Second one is what you mean?
NotInsyncYT:
Yes.
NotInsyncYT:
Correct, that is the right answer.
Rylee88:
So, B?
NotInsyncYT:
Yes, B.) is correct.
Rylee88:
Thank you!
NotInsyncYT:
Anytime, that's what Im here for!!!
Rylee88:
=)
Join our real-time social learning platform and learn together with your friends!
 Twaylor:
Time flies doesn't it? I tried to not be the second squeaky wheel of the household and ended up hurting myself and others severely.
Twaylor:
Time flies doesn't it? I tried to not be the second squeaky wheel of the household and ended up hurting myself and others severely.
 clllaaaaaire:
any tips? the quality isn't the best because I am using this site on my computer
clllaaaaaire:
any tips? the quality isn't the best because I am using this site on my computer
 Midnight97:
Kinda a roleplay story between me and my friend enjoy... Part one Forgive me for all the screenshots.
Midnight97:
Kinda a roleplay story between me and my friend enjoy... Part one Forgive me for all the screenshots.
 StevenisGhost:
what type of song should I make next, and will y'all go check out my new song on
Midnight97:
My drawing sure changed over the years look at these two pictures from 2024 to no
StevenisGhost:
what type of song should I make next, and will y'all go check out my new song on
Midnight97:
My drawing sure changed over the years look at these two pictures from 2024 to no
 EdwinJsHispanic:
"poem" love is So Beautiful to have. But it's so hard to have. At this point I don't know whether its worth the wait Or if it's just millions of miles to re
EdwinJsHispanic:
"poem" love is So Beautiful to have. But it's so hard to have. At this point I don't know whether its worth the wait Or if it's just millions of miles to re
EdwinJsHispanic:
"poem" love is So Beautiful to have. But it's so hard to have. At this point I don't know whether its worth the wait Or if it's just millions of miles to re
EdwinJsHispanic:
"poem" love is So Beautiful to have. But it's so hard to have. At this point I don't know whether its worth the wait Or if it's just millions of miles to re
 Breathless:
I don't know if this would be considered art, but its close enough I believe, Any
Breathless:
I don't know if this would be considered art, but its close enough I believe, Any