 Gucchi:
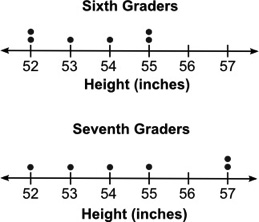
The two dot plots below show the heights of some sixth graders and some seventh graders: Two dot plots are shown one below the other. The title for the top dot plot is Sixth Graders and the title for the bottom plot is Seventh Graders. Below the line for each dot plot is written Height followed by inches in parentheses. There are markings from 52 to 57 on the top line and the bottom line at intervals of one. For the top line there are 2 dots above the first mark, 1 dot above the second mark, 1 dot above the third mark and 2 dots above the fourth mark. For the bottom line, there is 1 dot for the first mark, there is 1 dot above the second mark, there is 1 dot above the third mark, there is 1 dot above the fourth mark and there are two dots above the sixth mark. Picture will be attached! 1.2 1.4 2.4 2.8
1.4
Gucchi:
Am I right with B?
Gucchi:
@az
yes you are
 AZ:
AZ:
What is the question?
Gucchi:
Wdym?
AZ:
You attached the relevant image but this entire paragraph is just describing the image `Two dot plots are shown one below the other. The title for the top dot plot is Sixth Graders and the title for the bottom plot is Seventh Graders. Below the line for each dot plot is written Height followed by inches in parentheses. There are markings from 52 to 57 on the top line and the bottom line at intervals of one. For the top line there are 2 dots above the first mark, 1 dot above the second mark, 1 dot above the third mark and 2 dots above the fourth mark. For the bottom line, there is 1 dot for the first mark, there is 1 dot above the second mark, there is 1 dot above the third mark, there is 1 dot above the fourth mark and there are two dots above the sixth mark.`
AZ:
What are you trying to find/calculate What are those answer choices
Gucchi:
Oh yh sorry about that, just ignore that
AZ:
Ignoring that just leaves us with The two dot plots below show the heights of some sixth graders and some seventh graders: and so there's something incomplete
Gucchi:
OH
Gucchi:
I'm so sorry i forgot a part of the q
Gucchi:
The mean absolute deviation (MAD) for the first set of data is 1.2 and the MAD for the second set of data is 1.7. Approximately how many times the variability in the heights of the sixth graders is the variability in the heights of the seventh graders? (Round all values to the tenths place.)
AZ:
how many times the variability in 6th graders = variability in heights of 7th graders so x * 6th graders variability = 7th graders variability and they told us those numbers x * 1.2 = 1.7 x = 1.7/1.2 so yes, you are indeed correct
Gucchi:
Thank you!
AZ:
You're welcome!
Join our real-time social learning platform and learn together with your friends!
 Twaylor:
Time flies doesn't it? I tried to not be the second squeaky wheel of the household and ended up hurting myself and others severely.
Twaylor:
Time flies doesn't it? I tried to not be the second squeaky wheel of the household and ended up hurting myself and others severely.
 clllaaaaaire:
any tips? the quality isn't the best because I am using this site on my computer
clllaaaaaire:
any tips? the quality isn't the best because I am using this site on my computer
 Midnight97:
Kinda a roleplay story between me and my friend enjoy... Part one Forgive me for all the screenshots.
Midnight97:
Kinda a roleplay story between me and my friend enjoy... Part one Forgive me for all the screenshots.
 StevenisGhost:
what type of song should I make next, and will y'all go check out my new song on
Midnight97:
My drawing sure changed over the years look at these two pictures from 2024 to no
StevenisGhost:
what type of song should I make next, and will y'all go check out my new song on
Midnight97:
My drawing sure changed over the years look at these two pictures from 2024 to no
 EdwinJsHispanic:
"poem" love is So Beautiful to have. But it's so hard to have. At this point I don't know whether its worth the wait Or if it's just millions of miles to re
EdwinJsHispanic:
"poem" love is So Beautiful to have. But it's so hard to have. At this point I don't know whether its worth the wait Or if it's just millions of miles to re
EdwinJsHispanic:
"poem" love is So Beautiful to have. But it's so hard to have. At this point I don't know whether its worth the wait Or if it's just millions of miles to re
EdwinJsHispanic:
"poem" love is So Beautiful to have. But it's so hard to have. At this point I don't know whether its worth the wait Or if it's just millions of miles to re
 Breathless:
I don't know if this would be considered art, but its close enough I believe, Any
Breathless:
I don't know if this would be considered art, but its close enough I believe, Any