 angelcook2007:
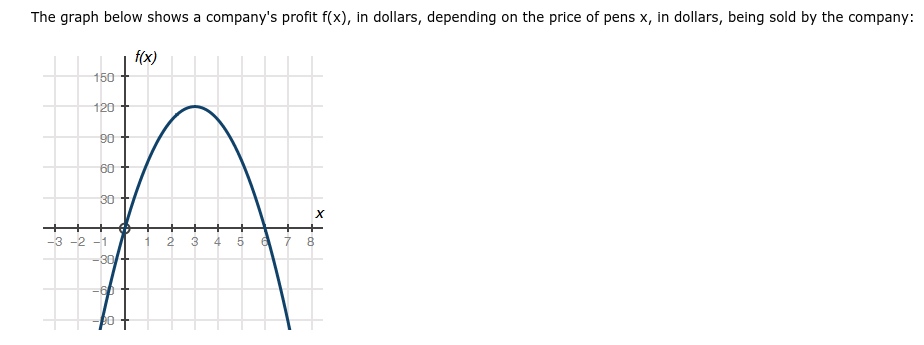
Part A: What do the x-intercepts and maximum value of the graph represent? What are the intervals where the function is increasing and decreasing, and what do they represent about the sale and profit? (6 points) Part B: What is an approximate average rate of change of the graph from x = 3 to x = 5, and what does this rate represent? (4 points)
 mhanifa:
First off, do you have any idea? Anything particularly you need help with?
angelcook2007:
angelcook2007:
I've done something similar to this before and it had product on the bottom and profit in the y axis
mhanifa:
This is similar
mhanifa:
Do you remember how you solved that?
Part A: What do the x-intercepts and maximum value of the graph represent? the profit this company makes is represented by \( f(x) \) right? that means where the lines intersect, that is going to be how much profit the company makes. in the image you attached, the \(x\) intercepts are \(0\), which means that they represent where this company's profit is \(0\) the maximum value of the graph, so vertex represents the maximum profit the company makes by selling \(3\) pens as you can see there in the \(y\) axis, and \( 120$ \). \(\cdot\)What are the intervals where the function is increasing and decreasing, and what do they represent about the sale and profit? well, we can see where the parabola starts there at \(0\) and finishes at \( 6 \), where 3 is the peak of it right? so we can say that if \(0\leq x \leq 3\) , then we have a profit increase, the left hand side, whilst on the right hand side we can see that if \(3\leq x \leq 6\) , we are going to have a profit decrease. Part B: What is an approximate average rate of change of the graph from x = 3 to x = 5, and what does this rate represent? (4 points) to figure that out we will be using this formula: \[ \frac{y_2 -y_1}{ x_2- x_1} \] where \[ (x_1 , y_1) \Rightarrow (3 , y_1 ) \text{ and } (x_2 , y_2) \Rightarrow (5 , y_2 ) \] to find the values of \( y_1 \) and \(y_2\) you will have to look at the graph after you find the values of both \( y\), then its pretty easy from there right?
angelcook2007:
@florisalreadytaken
Join our real-time social learning platform and learn together with your friends!
 Twaylor:
Time flies doesn't it? I tried to not be the second squeaky wheel of the household and ended up hurting myself and others severely.
Twaylor:
Time flies doesn't it? I tried to not be the second squeaky wheel of the household and ended up hurting myself and others severely.
 clllaaaaaire:
any tips? the quality isn't the best because I am using this site on my computer
clllaaaaaire:
any tips? the quality isn't the best because I am using this site on my computer
 Midnight97:
Kinda a roleplay story between me and my friend enjoy... Part one Forgive me for all the screenshots.
Midnight97:
Kinda a roleplay story between me and my friend enjoy... Part one Forgive me for all the screenshots.
 StevenisGhost:
what type of song should I make next, and will y'all go check out my new song on
Midnight97:
My drawing sure changed over the years look at these two pictures from 2024 to no
StevenisGhost:
what type of song should I make next, and will y'all go check out my new song on
Midnight97:
My drawing sure changed over the years look at these two pictures from 2024 to no
 EdwinJsHispanic:
"poem" love is So Beautiful to have. But it's so hard to have. At this point I don't know whether its worth the wait Or if it's just millions of miles to re
EdwinJsHispanic:
"poem" love is So Beautiful to have. But it's so hard to have. At this point I don't know whether its worth the wait Or if it's just millions of miles to re
EdwinJsHispanic:
"poem" love is So Beautiful to have. But it's so hard to have. At this point I don't know whether its worth the wait Or if it's just millions of miles to re
EdwinJsHispanic:
"poem" love is So Beautiful to have. But it's so hard to have. At this point I don't know whether its worth the wait Or if it's just millions of miles to re
 Breathless:
I don't know if this would be considered art, but its close enough I believe, Any
Breathless:
I don't know if this would be considered art, but its close enough I believe, Any