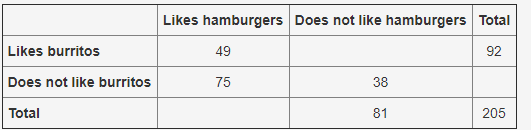
A food truck did a daily survey of customers to find their food preferences. The data is partially entered in the frequency table. Complete the table to analyze the data and answer the questions: Likes hamburgers Does not like hamburgers Total Likes burritos 49 92 Does not like burritos 75 38 Total 81 205 Part A: What percentage of the survey respondents do not like both hamburgers and burritos? (2 points) Part B: What is the marginal relative frequency of all customers that like hamburgers? (3 points) Part C: Use the conditional relative frequencies to determine which data point has strongest association of its two factors. Use complete sentences to explain your answer. (5 points)
 SmokeyBrown:
For A, you can see that the number of people who don't like burritos AND don't like hamburgers is in the square where that column and row overlap: 38. Then the total of all the customers is in the bottom right: 205. So, you can find the percentage by dividing 38/205 (and multiplying by 100) I'm not very familiar with relative frequencies, which are needed for parts B and C... Maybe we can ask someone else who might know...
SmokeyBrown:
No problem. @mhanifa might be able to help more, maybe?
@smokeybrown ok ty
 mhanifa:
The marginal relative frequencies are found by adding the joint relative frequencies in each row and column. To find a conditional relative frequency , divide the joint relative frequency by the marginal relative frequency.
mhanifa:
Part B Add 49 and 75
mhanifa:
Fill in the table first, the totals on the right column and bottom row are sums of the previous two numbers
mhanifa:
Then you may convert all numbers to percent considering 205 is 100%, (you will change the table of numbers into table of percent value of those in terms of total of 205) this will help to solve the part C
Join our real-time social learning platform and learn together with your friends!
 Twaylor:
Time flies doesn't it? I tried to not be the second squeaky wheel of the household and ended up hurting myself and others severely.
Twaylor:
Time flies doesn't it? I tried to not be the second squeaky wheel of the household and ended up hurting myself and others severely.
 clllaaaaaire:
any tips? the quality isn't the best because I am using this site on my computer
clllaaaaaire:
any tips? the quality isn't the best because I am using this site on my computer
 Midnight97:
Kinda a roleplay story between me and my friend enjoy... Part one Forgive me for all the screenshots.
Midnight97:
Kinda a roleplay story between me and my friend enjoy... Part one Forgive me for all the screenshots.
 StevenisGhost:
what type of song should I make next, and will y'all go check out my new song on
Midnight97:
My drawing sure changed over the years look at these two pictures from 2024 to no
StevenisGhost:
what type of song should I make next, and will y'all go check out my new song on
Midnight97:
My drawing sure changed over the years look at these two pictures from 2024 to no
 EdwinJsHispanic:
"poem" love is So Beautiful to have. But it's so hard to have. At this point I don't know whether its worth the wait Or if it's just millions of miles to re
EdwinJsHispanic:
"poem" love is So Beautiful to have. But it's so hard to have. At this point I don't know whether its worth the wait Or if it's just millions of miles to re
EdwinJsHispanic:
"poem" love is So Beautiful to have. But it's so hard to have. At this point I don't know whether its worth the wait Or if it's just millions of miles to re
EdwinJsHispanic:
"poem" love is So Beautiful to have. But it's so hard to have. At this point I don't know whether its worth the wait Or if it's just millions of miles to re
 Breathless:
I don't know if this would be considered art, but its close enough I believe, Any
Breathless:
I don't know if this would be considered art, but its close enough I believe, Any