 jhellai20:
Do you guys know the word problem about Food production, it goes like this "The table below shows pork production in China from 2000 to 2007." I saw the answer to this problem in this website but I wasn't quite sure where they got some of the answers
 SmokeyBrown:
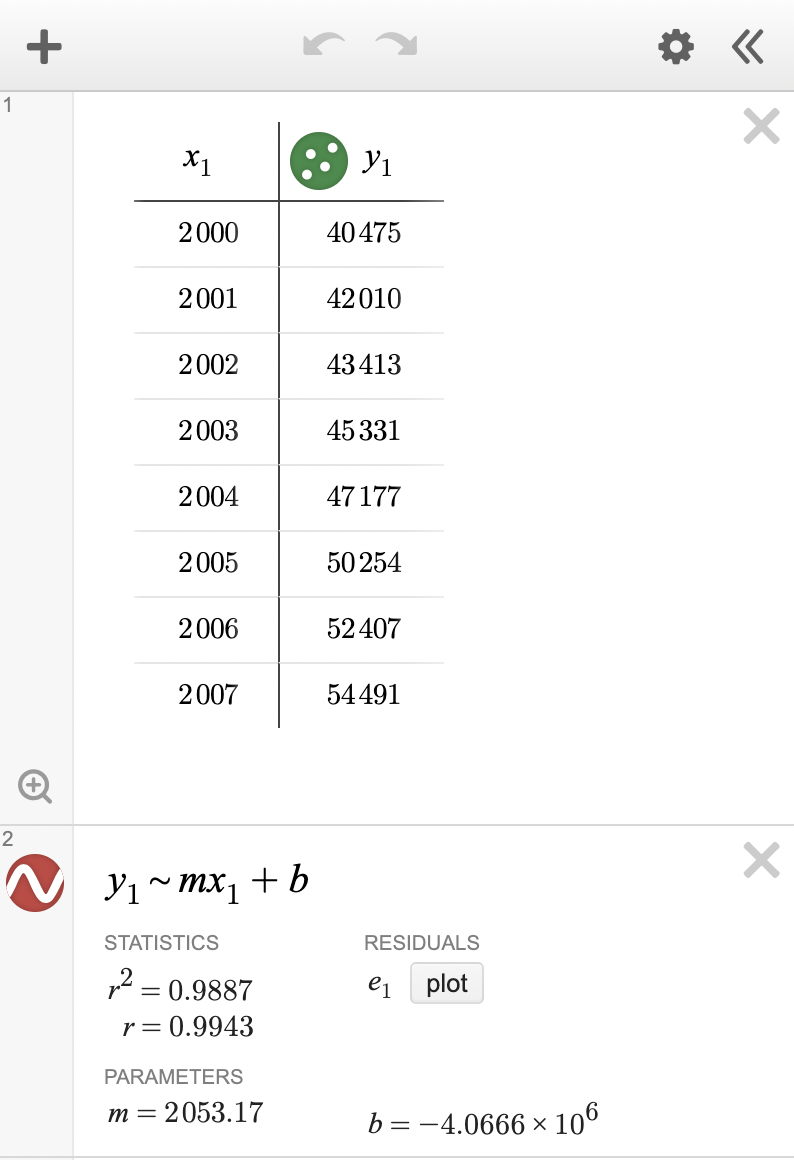
Hi and welcome to QuestionCove! I did a quick Bing search for the problem you described. Does it go something like this: The table below shows pork production in China from 2000 to 2007. Use a calculator to find the line of best fit. b. Use your linear model to predict how many metric tons of pork will be produced in 2025 ... c. Use your linear model to predict when production is likely to reach 100,000 metric tons ... [Year: 2000, 2001, 2002, 2003, 2004, 2005, 2006, 2007. Production (metric tons) : 40,475, 42,010, 43,413, 45,331, 47,177, 50,254, 52,407, 54,491
SmokeyBrown:
It seems you'd want to use a graphing calculator or some similar linear plotting tool in order to solve this problem. Once you have your line of best fit, parts b. and c. rely on extrapolation (extending the data outward to make predictions) and interpolation (filling in the gaps of data to account for unmarked points), respectively
jhellai20:
The word problem had a table to I plugged those in on desmos. The equation I found on this website was y=2053.17x + 39759 I know the 2053.17x part, but I'm not sure where they got the 39759 from
SmokeyBrown:
As you probably understand, 2053.17x represents the growth of food production each year. We could think of that as meaning "on average, the tons produced increase by 2053.17 per year" The 39759 is the y-intercept of the equation, which is what the value would be when x=0, or in this case, if we go back to the first year that the equation accounts for. Notice that the first year production is 40,475, which is quite close to the y-intercept of 39,759. The line of best fit will not match up with the data points exactly, but it is quite close; this is sort of like an estimation for what the production levels were at the very beginning of the data in the table
jhellai20:
Do you have an equation of how you got 39,759? bc i dont really get what u mean when you said that the first year production was close to 39,759
jhellai20:
Here is a screenshot of my desmos which gave me the growth of food production each year
 SmokeyBrown:
If you want to know exactly how the value of 39,759 was found for the equation, you can review the method and calculations for finding a line of best fit based on a set of data points here (least-square method) https://www.varsitytutors.com/hotmath/hotmath_help/topics/line-of-best-fit In terms of understanding conceptually what 39,759 means for your line, this is saying that, based on the line of best fit you are using, the estimated amount produced would be 39,759 in the year 2000. This is different from the actual amount of 40,475 by about 800, but the estimated value is pretty close to the actual value; this is a good sign that the line of best fit somewhat represents the values of the existing data points
jhellai20:
oh okay thank you so much I didn't expect for someone to actually reply to my problem
SmokeyBrown:
Similarly, 2053.17 growth rate is an estimate too; in some years, the production increases by more, and in some years it increases by less, but this is the rate which was calculated to be the best estimate--the best fit, based on the data points given. It does seem like the actual calculations for finding this equation are a bit complicated, so that is probably why you are able to use a calculator for this problem. And I'm glad to help, it's not a problem. If I'm able to help at all, then I'm glad :)
SmokeyBrown:
Oh, I almost forgot about the other parts of the question, now that you've found your line of best fit. So, b. asks you to predict the production of pork in 2025. Using the equation of the best-fit line you found, y=2053.17x + 39759 if x=0 corresponds to the year 2000, then x = 25 will correspond to the year 2025; simply plug "25" into the equation in place of x in order to get your estimate For part c, to estimate what year production will reach 100,000, substitute y for 100,000 and then use algebra to solve for x, i.e. 100,000 = 2053.17x + 39759 Then, add the value you find for "x" to 2000 to get the estimated year, since "0" represents the year "2000" in this case
jhellai20:
Yes I've already done those parts too. Thank you smokeybrown
SmokeyBrown:
Oh, wonderful. Glad you figured it out!
Join our real-time social learning platform and learn together with your friends!
 natalieee:
who else wants a job in biology? I love biomedical science and want to work with
natalieee:
who else wants a job in biology? I love biomedical science and want to work with
 Twaylor:
Time flies doesn't it? I tried to not be the second squeaky wheel of the household and ended up hurting myself and others severely.
Twaylor:
Time flies doesn't it? I tried to not be the second squeaky wheel of the household and ended up hurting myself and others severely.
 clllaaaaaire:
any tips? the quality isn't the best because I am using this site on my computer
clllaaaaaire:
any tips? the quality isn't the best because I am using this site on my computer
 Midnight97:
Kinda a roleplay story between me and my friend enjoy... Part one Forgive me for all the screenshots.
Midnight97:
Kinda a roleplay story between me and my friend enjoy... Part one Forgive me for all the screenshots.
 StevenisGhost:
what type of song should I make next, and will y'all go check out my new song on
Midnight97:
My drawing sure changed over the years look at these two pictures from 2024 to no
StevenisGhost:
what type of song should I make next, and will y'all go check out my new song on
Midnight97:
My drawing sure changed over the years look at these two pictures from 2024 to no
 EdwinJsHispanic:
"poem" love is So Beautiful to have. But it's so hard to have. At this point I don't know whether its worth the wait Or if it's just millions of miles to re
EdwinJsHispanic:
"poem" love is So Beautiful to have. But it's so hard to have. At this point I don't know whether its worth the wait Or if it's just millions of miles to re
EdwinJsHispanic:
"poem" love is So Beautiful to have. But it's so hard to have. At this point I don't know whether its worth the wait Or if it's just millions of miles to re
EdwinJsHispanic:
"poem" love is So Beautiful to have. But it's so hard to have. At this point I don't know whether its worth the wait Or if it's just millions of miles to re