 Jaynater:
I'm trying to figure out graphing with polynomials, more specifically how to create a polynomial function based off of certain data points. Can anyone provide a good example of how I should go about this?
 Vocaloid:
some things to keep in mind - if they give you any specific intercepts/points then graph those, making sure your graph intersects with them - look at end behavior: if the degree (max exponent) is odd, the ends will go in opposite direction (ex: y = x^3. as x ---> positive infinity, y goes to positive infinity. as x ---> negative infinity, y goes to negative infinity). if the degree is even, the ends will go in the same direction. also look at the sign on the leading coefficient. ex: y = -x^3 flips the end behavior, now it goes x ---> positive infinity, y ---> negative infinity - factor your polynomial, if possible, or otherwise find roots. also pay attention to the multiplicity of roots. if y = (x-1) * (x-2)^2: (x-1) has a multiplicity of 1 (the root x = 1 appears once) so the graph passes through x = 1, y = 0. (x-2)^2 has multiplicty of 2, so the graph touches x = 2 but instead of going through it goes back in the opposite direction after that. - consider asymptotes (vertical, horizontal, oblique) that's all I can think of off the top of my head here's some references: https://courses.lumenlearning.com/wmopen-collegealgebra/chapter/graphs-of-polynomial-functions/ https://www.purplemath.com/modules/asymtote4.htm
Vocaloid:
(not sure if I understood the problem correctly - do you have any specific problems to work through?)
Jaynater:
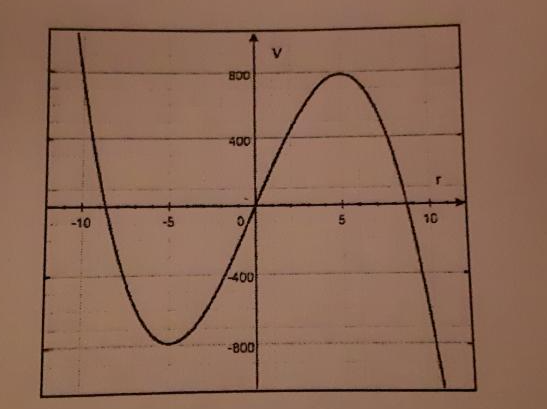
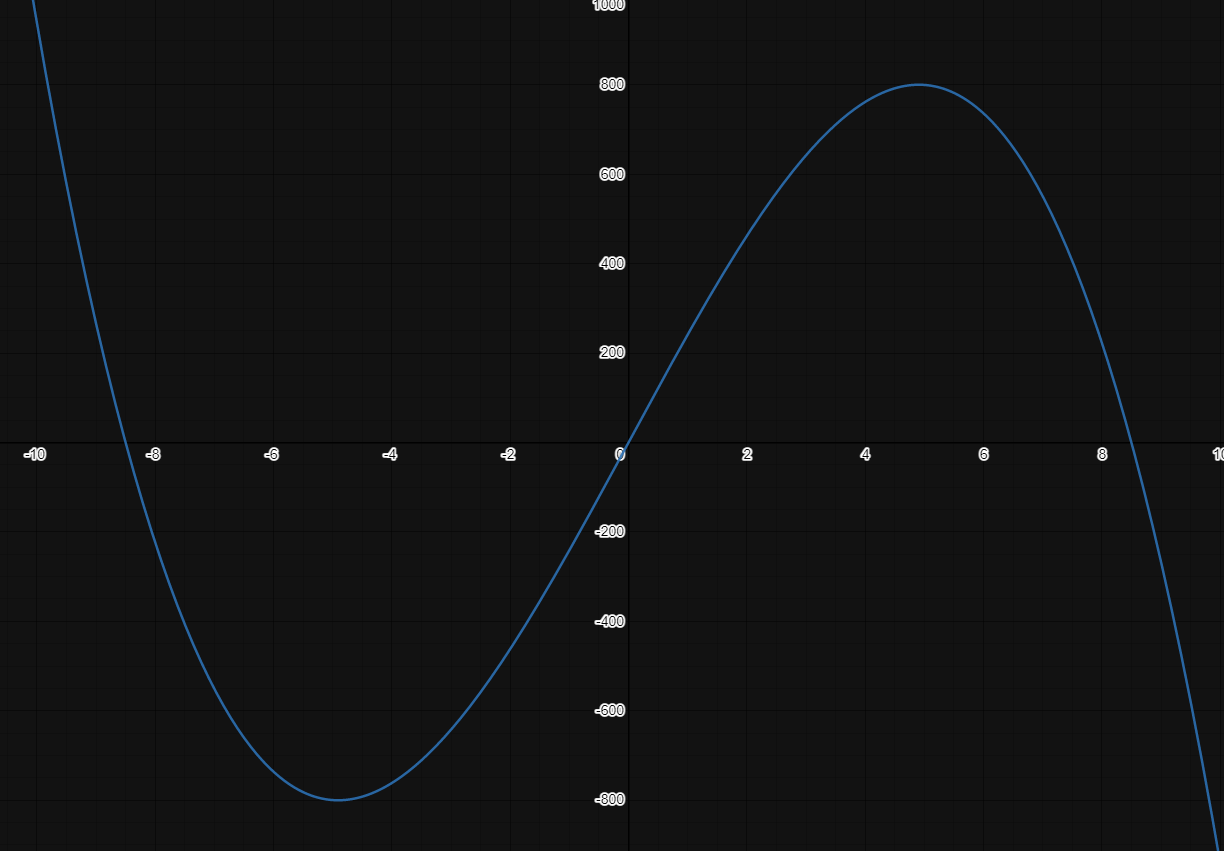
An example problem on the homework goes like this: Jeannie wishes to construct a cylinder closed at both ends. The figure below shows the graph of a cubic polynomial function used to model the volume of the cylinder as a function of the radius if the cylinder is constructed using \(150\pi~cm^2\) of material. Use the graph to answer the questions below. Estimate values to the nearest half unit on the horizontal axis and to the nearest 50 units on the vertical axis. \(The~Graph\)
 Jaynater:
I have 5 problems to work through. 1. What are the zeos of the function 2. What are the relative Maximum and the relative minimum values of the function? 3. The equation of this function is \(V(r) = c(r^3 - 72.25r)\) for some real number \(c\). Find the value of c so that this formula fits the graph. 4. Use the graph to estimate the volume of the cylinder with r = 2cm. 5. Use your formula to find the volume of the cylinder when r = 2 cm. How close is the value from the formula to the value on the graph?
Jaynater:
I'm trying my hardest to get through 3, but no matter how I graph it, it doesn't compare to the original at all.
Jaynater:
I understand how to find the zeros, as I can just estimate them by looking at the graph without a function. I'm also expected to estimate the relative maximum and relative minimum of this function; all within human error of course.
Vocaloid:
if you look at the graph, you can see r = 5 and V = (about) 800 so you could plug in V = 800 and r = 5, solve for c, and use that as your c-value I tested it real quick and I got a graph that's p. much like the one in the picture
Vocaloid:
(5,800) is just one of the possible points, it stood out to me because it's easy to identify on the graph
Jaynater:
I plugged in 5 and 790, as the graph doesn't quite touch the 800 mark.
Jaynater:
For c, I somehow obtained -.021
Vocaloid:
you have the right idea but the problem does state: Estimate values to the nearest half unit on the horizontal axis and to the nearest 50 units on the vertical axis, so I think 800 is probably the better bet here. you could also leave it in fractional form to be more accurate.
Vocaloid:
I don't think it makes that much of a difference either way because it is just an estimate of the graph.
Jaynater:
Right, right. I'll plug in with the new estimated values and see what I get for c so the math teacher does question my ethics. Another point of note: My maximum and minimum seem to not even come close to the points specified when graphed by calculator with current equation. Did I do something incorrect?
Vocaloid:
wait - how did you get -0.021 as c? V(r) = c(r^3 - 72.25r) 800 = c(5^3 - 72.25*5) c = -800/236.25 = about -3.39
Jaynater:
Remember, I plugged in for (5, 790) at first. Also, my math teacher told me to keep the r in V(r) and not the V.
Vocaloid:
Keep the r in V(r)... ? that doesn't make any sense, V(r) means function of V with respect to r, it doesn't mean V multiplied by r, or anything else. V(r) at r = 5 would be 800 (or 790 or whatever rounded value you used)
Jaynater:
Which makes sense since we just see the f(x) function as, more or less, a fancy-pants y value.
Jaynater:
I should've known better. Sorry about that.
Vocaloid:
Repeating the calculation with V = 790 gives me c = -3.3
Jaynater:
I reworked the problem with the new rounded (5, 800) and obtained c = -3.386. I'm going to plug this into the graphing calculator to see if it compares instead of... whatever it was doing before now that you've helped correct me.
 Jaynater:
It is, in fact, comparable.
Vocaloid:
cool I think 4 and 5 are fairly straightforward, 4 is just estimating V at r = 2 using the original graph, and 5 is plugging r = 2 into the formula, and comparing them. they should be similar.
Jaynater:
Ye, I got that much now thanks to you. I think there's one more thing that has me confused though, and that's specific calculator functions like regression that I'm expected to know for an entirely different problem.
Jaynater:
Idk if I can be helped out with that though. xD
Vocaloid:
every calculator is different, but there should be instructions online on how to plug in values and calculate the appropriate regression equation
Jaynater:
Alright. Thanks Voca.
Join our real-time social learning platform and learn together with your friends!
 Twaylor:
Time flies doesn't it? I tried to not be the second squeaky wheel of the household and ended up hurting myself and others severely.
Twaylor:
Time flies doesn't it? I tried to not be the second squeaky wheel of the household and ended up hurting myself and others severely.
 clllaaaaaire:
any tips? the quality isn't the best because I am using this site on my computer
clllaaaaaire:
any tips? the quality isn't the best because I am using this site on my computer
 Midnight97:
Kinda a roleplay story between me and my friend enjoy... Part one Forgive me for all the screenshots.
Midnight97:
Kinda a roleplay story between me and my friend enjoy... Part one Forgive me for all the screenshots.
 StevenisGhost:
what type of song should I make next, and will y'all go check out my new song on
Midnight97:
My drawing sure changed over the years look at these two pictures from 2024 to no
StevenisGhost:
what type of song should I make next, and will y'all go check out my new song on
Midnight97:
My drawing sure changed over the years look at these two pictures from 2024 to no
 EdwinJsHispanic:
"poem" love is So Beautiful to have. But it's so hard to have. At this point I don't know whether its worth the wait Or if it's just millions of miles to re
EdwinJsHispanic:
"poem" love is So Beautiful to have. But it's so hard to have. At this point I don't know whether its worth the wait Or if it's just millions of miles to re
EdwinJsHispanic:
"poem" love is So Beautiful to have. But it's so hard to have. At this point I don't know whether its worth the wait Or if it's just millions of miles to re
EdwinJsHispanic:
"poem" love is So Beautiful to have. But it's so hard to have. At this point I don't know whether its worth the wait Or if it's just millions of miles to re
 Breathless:
I don't know if this would be considered art, but its close enough I believe, Any
Breathless:
I don't know if this would be considered art, but its close enough I believe, Any