 Joe348:
which solution equals f(x)=5/2x-1?
 Mage:
Mage:
if you find and apply the slope (aka the mx value or rise over run fraction) you will move up from an intercept on the graph by whatever number takes place over the numerator and across by the number of the denominator. in this case, the slope is 5/2 and the y-intercept is -1. so start by putting a dot at -1 (0, -1 since it's the intercept) and move up 5 units and to the right 2 units. plot where you end up afterwards and then connect the dots with a straight-edge. the line will be diagonal.
Joe348:
so the 1st one?
Mage:
the straight line?? no not at all, apply what i just said
Joe348:
I don't understand
Mage:
let me try to help you visualize
Joe348:
so if it's not the first one then the second and ok?
 Mage:
Mage:
start at (0,-1), that's the intercept. put a dot.
 axie:
axie:
Joe, you forgot to type in X for the first problem that's why the line is straight
axie:
It should be 5/2x not just 5/2
Mage:
That's....that's just an answer choice
axie:
I explained what he did wrong from those 2 answer choices
axie:
So therefore, the 2nd answer would be the most reasonable Or he could just use desmos.com proving as a accurate site to answer this problem
Mage:
or he could actually work it out, you know. like i explained
Mage:
i literally said it's going to be diagonal
axie:
Okay, I understand... I was just trying to explain what went wrong from my point of view
axie:
But if you feel if I'm interfering I will stop trying to help while you can
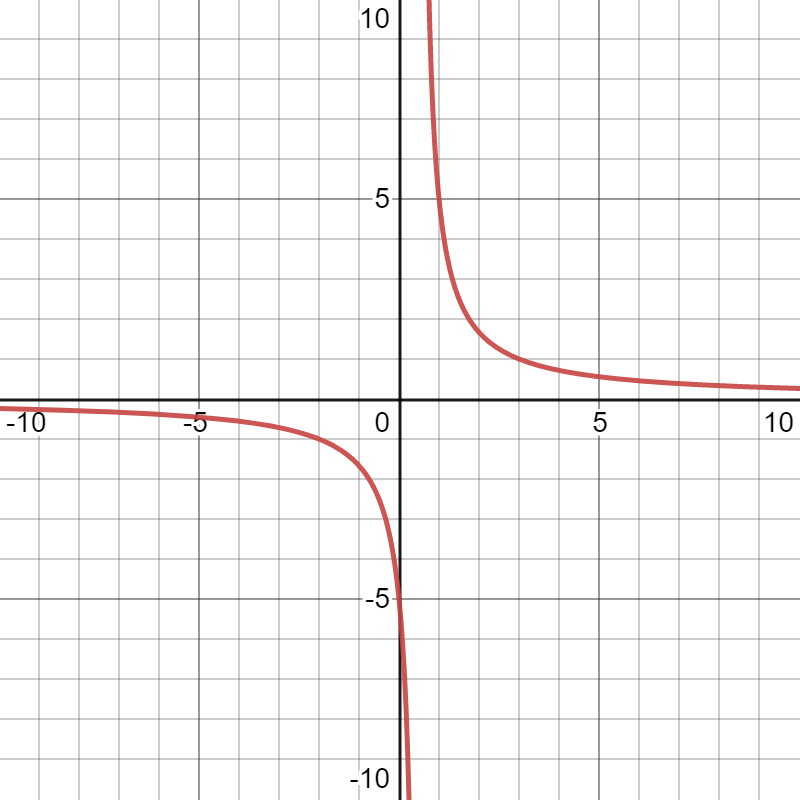
this is the graph of \[f(x)=\frac{ 5 }{ 2x-1 }\]
 mxddi3:
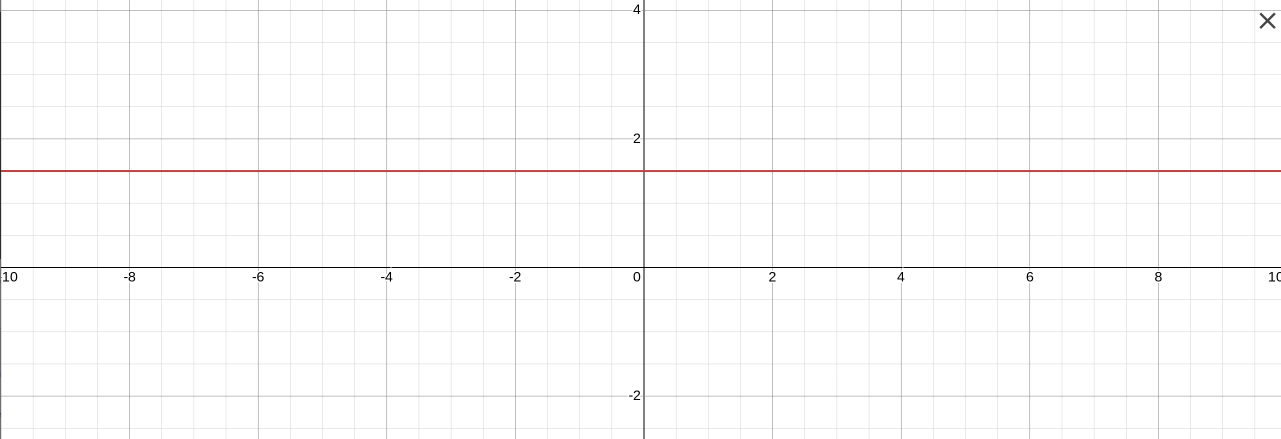
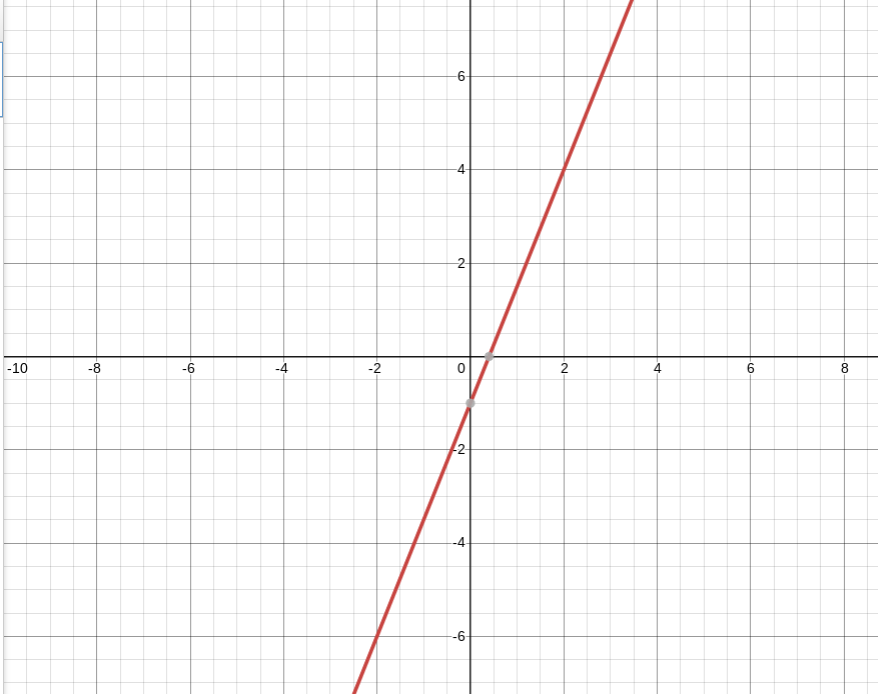
Joe, the first image is a horizontal line, meaning we would have a slope of 0. The equation of this line would be something like "y=3" Now for the equation, we have a y-intercept of -1, meaning we must go to the point (0,-1) and plot a point on our graph. Then from there, we go up 5 on the y-axis, meaning we get to (0,1.5). Then we go over 2 spaces on the x-axis to the point (1,1.5) So, image 2 is indeed the graph that represents the function.
Joe348:
Okay thank you, I understand what you mean
Joe348:
So like the first one would should be y=3 or y=1
Joe348:
so like whenever a line is like that it is always y=1 no X?
mxddi3:
oh that was just an example of what a line with an undefined slope is. For your specific graph, it's always y=# in your case y=1.5. do you see how i got the 1.5? because the graph is increasing by 0.5 each time.
Joe348:
No?
Joe348:
wait that 5/2?
Joe348:
like the sope? slope*
mxddi3:
the slope is 5/2, yes. But the interval in which your graph increases is 0.5. Each line represents 0.5 like such |dw:1636414524877:dw| each line represents 0.5
Joe348:
OH OKAY, thank you maddi
Joe348:
@mxddi3
Join our real-time social learning platform and learn together with your friends!
 natalieee:
who else wants a job in biology? I love biomedical science and want to work with
natalieee:
who else wants a job in biology? I love biomedical science and want to work with
 Twaylor:
Time flies doesn't it? I tried to not be the second squeaky wheel of the household and ended up hurting myself and others severely.
Twaylor:
Time flies doesn't it? I tried to not be the second squeaky wheel of the household and ended up hurting myself and others severely.
 clllaaaaaire:
any tips? the quality isn't the best because I am using this site on my computer
clllaaaaaire:
any tips? the quality isn't the best because I am using this site on my computer
 Midnight97:
Kinda a roleplay story between me and my friend enjoy... Part one Forgive me for all the screenshots.
Midnight97:
Kinda a roleplay story between me and my friend enjoy... Part one Forgive me for all the screenshots.
 StevenisGhost:
what type of song should I make next, and will y'all go check out my new song on
Midnight97:
My drawing sure changed over the years look at these two pictures from 2024 to no
StevenisGhost:
what type of song should I make next, and will y'all go check out my new song on
Midnight97:
My drawing sure changed over the years look at these two pictures from 2024 to no
 EdwinJsHispanic:
"poem" love is So Beautiful to have. But it's so hard to have. At this point I don't know whether its worth the wait Or if it's just millions of miles to re
EdwinJsHispanic:
"poem" love is So Beautiful to have. But it's so hard to have. At this point I don't know whether its worth the wait Or if it's just millions of miles to re
EdwinJsHispanic:
"poem" love is So Beautiful to have. But it's so hard to have. At this point I don't know whether its worth the wait Or if it's just millions of miles to re
EdwinJsHispanic:
"poem" love is So Beautiful to have. But it's so hard to have. At this point I don't know whether its worth the wait Or if it's just millions of miles to re