 DiabolikLover:
Im very confused, can someone explain this in non math terms? Screen Shots in Comments
DiabolikLover:
https://docs.google.com/document/d/1MdLAMs6vyxkE2We1oy02Mo0G4VZzJKPmpGTQYz--dgg/edit?usp=sharing link to survey
 P1n3appl31:
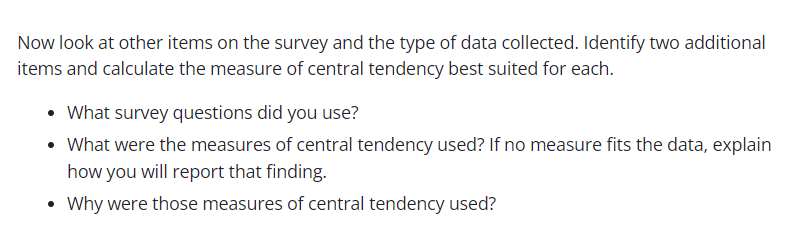
I might be able to translate it, but if it doesn't make sense to you then I tried my best. It's saying that it wants you to look at the tables and the information that you put in the tables and calculate two additional things in there that best fits the topic. the first thing is asking what questions did you ask, the second meant what the results were for the additional things, and the third one is explaining why you chose the two things to calculate.
P1n3appl31:
 Vocaloid:
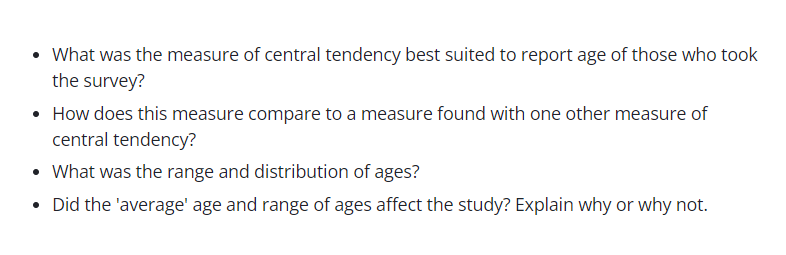
What was the measure of central tendency best suited to report the ages of those who took the study? - in general, there are three central measures of tendency (mean, median, and mode). for most situations, you'll either be using median or mode. look at your age data for your survey - are there any significant outliers? (any values significantly above or below the rest)? typically, if there are no significant outliers, we use the mean. otherwise, we use the median as it's more resistant to outliers.
Vocaloid:
How does this measure compare to a measure found w/ one other measure of central tendency? - whichever one you calculated from before (median or mean), calculate the other one, and compare the two values What was the range and distribution? - range is highest - lowest value. for distribution, think about whether the data is symmetric, skewed left/right, or has some other distribution like bimodal (two clusters with two means). I'll attach examples below. symmetric vs. skewed distributions: https://www.assetinsights.net/Concepts/Curve_Symmetrical_and_Skewed.JPG here's a bimodal example: https://study.com/cimages/multimages/16/graph_avg_weight1.png these are not the only possibilities, but there's a good chance your data fits one of these.
DiabolikLover:
sorry for not being responsive. i didnt know I needed to have an age question so that one doesn't apply. i have already talked to my teacher about it. i forgot to re state that I the question as well. i just added it so it would be the complete thing.
Vocaloid:
oh ok. the logic remains pretty much the same.
DiabolikLover:
ok cool, thanks so much
Join our real-time social learning platform and learn together with your friends!
 Twaylor:
Time flies doesn't it? I tried to not be the second squeaky wheel of the household and ended up hurting myself and others severely.
Twaylor:
Time flies doesn't it? I tried to not be the second squeaky wheel of the household and ended up hurting myself and others severely.
 clllaaaaaire:
any tips? the quality isn't the best because I am using this site on my computer
clllaaaaaire:
any tips? the quality isn't the best because I am using this site on my computer
 Midnight97:
Kinda a roleplay story between me and my friend enjoy... Part one Forgive me for all the screenshots.
Midnight97:
Kinda a roleplay story between me and my friend enjoy... Part one Forgive me for all the screenshots.
 StevenisGhost:
what type of song should I make next, and will y'all go check out my new song on
Midnight97:
My drawing sure changed over the years look at these two pictures from 2024 to no
StevenisGhost:
what type of song should I make next, and will y'all go check out my new song on
Midnight97:
My drawing sure changed over the years look at these two pictures from 2024 to no
 EdwinJsHispanic:
"poem" love is So Beautiful to have. But it's so hard to have. At this point I don't know whether its worth the wait Or if it's just millions of miles to re
EdwinJsHispanic:
"poem" love is So Beautiful to have. But it's so hard to have. At this point I don't know whether its worth the wait Or if it's just millions of miles to re
EdwinJsHispanic:
"poem" love is So Beautiful to have. But it's so hard to have. At this point I don't know whether its worth the wait Or if it's just millions of miles to re
EdwinJsHispanic:
"poem" love is So Beautiful to have. But it's so hard to have. At this point I don't know whether its worth the wait Or if it's just millions of miles to re
 Breathless:
I don't know if this would be considered art, but its close enough I believe, Any
Breathless:
I don't know if this would be considered art, but its close enough I believe, Any