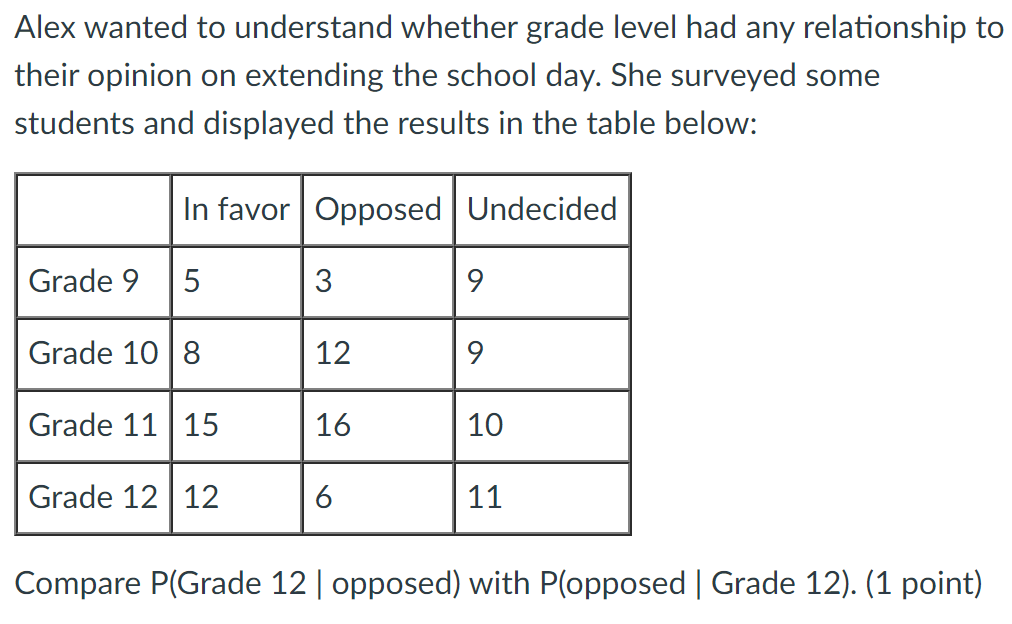
Alex wanted to understand whether grade level had any relationship to their opinion on extending the school day. She surveyed some students and displayed the results in the table below: In favor Opposed Undecided Grade 9 5 3 9 Grade 10 8 12 9 Grade 11 15 16 10 Grade 12 12 6 11 Compare P(Grade 12 | opposed) with P(opposed | Grade 12).
 Fortish:
@astrid1
above is the chart and the answer options are: P(Grade 12 | opposed) = P(opposed | Grade 12) P(Grade 12 | opposed) > P(opposed | Grade 12) P(Grade 12 | opposed) < P(opposed | Grade 12) There is not enough information.
Fortish:
@joe348
 SmokeyBrown:
Hi and welcome to QuestionCove! P(Grade 12 | opposed) is the probability that the student is in grade 12, given that they oppose extending the school day. We can calculate this probability by taking ([Number of students in grade 12 AND oppose extending the school day]/[Number of students who oppose extending the school day]) The chart shows that 6 students are in grade 12 AND oppose extending the school day. The chart shows that 37 students total oppose extending the school day. So, P(Grade 12 | opposed) = 6/37 P(opposed | Grade 12) is the probability that the student opposes extending the school day, given that they are in grade 12. We can calculate this probability by taking ([Number of students in grade 12 AND oppose extending the school day]/[Number of students who are in grade 12]) Like before, 6 students are in grade 12 AND oppose extending the school day. We also see that there are 29 total students in grade 12. So, P(Grade 12 | opposed) = 6/29 Which of these two probabilities is greater?
Join our real-time social learning platform and learn together with your friends!
 natalieee:
who else wants a job in biology? I love biomedical science and want to work with
natalieee:
who else wants a job in biology? I love biomedical science and want to work with
 Twaylor:
Time flies doesn't it? I tried to not be the second squeaky wheel of the household and ended up hurting myself and others severely.
Twaylor:
Time flies doesn't it? I tried to not be the second squeaky wheel of the household and ended up hurting myself and others severely.
 clllaaaaaire:
any tips? the quality isn't the best because I am using this site on my computer
clllaaaaaire:
any tips? the quality isn't the best because I am using this site on my computer
 Midnight97:
Kinda a roleplay story between me and my friend enjoy... Part one Forgive me for all the screenshots.
Midnight97:
Kinda a roleplay story between me and my friend enjoy... Part one Forgive me for all the screenshots.
 StevenisGhost:
what type of song should I make next, and will y'all go check out my new song on
Midnight97:
My drawing sure changed over the years look at these two pictures from 2024 to no
StevenisGhost:
what type of song should I make next, and will y'all go check out my new song on
Midnight97:
My drawing sure changed over the years look at these two pictures from 2024 to no
 EdwinJsHispanic:
"poem" love is So Beautiful to have. But it's so hard to have. At this point I don't know whether its worth the wait Or if it's just millions of miles to re
EdwinJsHispanic:
"poem" love is So Beautiful to have. But it's so hard to have. At this point I don't know whether its worth the wait Or if it's just millions of miles to re
EdwinJsHispanic:
"poem" love is So Beautiful to have. But it's so hard to have. At this point I don't know whether its worth the wait Or if it's just millions of miles to re
EdwinJsHispanic:
"poem" love is So Beautiful to have. But it's so hard to have. At this point I don't know whether its worth the wait Or if it's just millions of miles to re