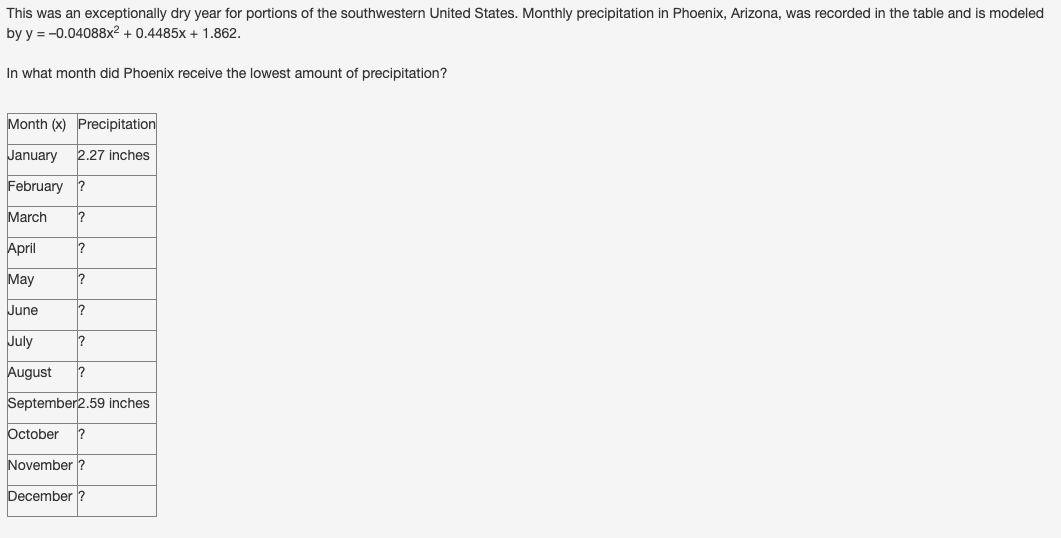
This was an exceptionally dry year for portions of the southwestern United States. Monthly precipitation in Phoenix, Arizona, was recorded in the table and is modeled by y = –0.04088x2 + 0.4485x + 1.862. In what month did Phoenix receive the lowest amount of precipitation? Month (x) Precipitation January 2.27 inches February ? March ? April ? May ? June ? July ? August ? September 2.59 inches October ? November ? December ? Sketch a graph or fill in the table to answer the question. January February November December
 MaxTon:
home work or test q uestion
regular assigment
Hello?
 Extrinix:
Can you screenshot the table please.
MaxTon:
okay well can you like show us the table
its not january btw
?
MaxTon:
dang this might take me a little bit
Im just happy for any help
MaxTon:
well josh is typing witch means he has the answer so if i don't back in time he has it
hes been "typing" for over 6 min.
?
Extrinix:
So to start off, you should know that the precipitation is y and the month is x (as shown). Now, to solve for what the x is in each of these months, you must solve for x by using the given precipitation amounts. e.g. for this one, you would have to do January and September's y values. \(\sf{2.27 = -0.04485(x)+1.862}\) and \(\sf{2.59 = -0.04485(x)+1.862}\) All you have to do here is solvee for x, get what it is, and see how the values should change. January: \(\sf{2.27 = -0.04485(x)+1.862}\) \(\sf{0.41 = -0.04485(x)}\) \(\sf{0.37 = x}\) You can repeat that for September and get what x is, and between the two datess, you can figure out what the average precipitation is. Best of luck, \(\style{font Family:Arial; text-shadow: 2px 2px 3px white, 0 0 10px white, 0 0 5px white;color:#23B7F3;font-size:100px;padding:50px;width:500px;height:100%;position:absolute;left:0;z-index:500;text-align:center;} {\Huge\sf\color {} {{-~Akuma~matata}}}\)
Thank you so much!
Extrinix:
Of course!
MaxTon:
see told u
Join our real-time social learning platform and learn together with your friends!
 Twaylor:
Time flies doesn't it? I tried to not be the second squeaky wheel of the household and ended up hurting myself and others severely.
Twaylor:
Time flies doesn't it? I tried to not be the second squeaky wheel of the household and ended up hurting myself and others severely.
 clllaaaaaire:
any tips? the quality isn't the best because I am using this site on my computer
clllaaaaaire:
any tips? the quality isn't the best because I am using this site on my computer
 Midnight97:
Kinda a roleplay story between me and my friend enjoy... Part one Forgive me for all the screenshots.
Midnight97:
Kinda a roleplay story between me and my friend enjoy... Part one Forgive me for all the screenshots.
 StevenisGhost:
what type of song should I make next, and will y'all go check out my new song on
Midnight97:
My drawing sure changed over the years look at these two pictures from 2024 to no
StevenisGhost:
what type of song should I make next, and will y'all go check out my new song on
Midnight97:
My drawing sure changed over the years look at these two pictures from 2024 to no
 EdwinJsHispanic:
"poem" love is So Beautiful to have. But it's so hard to have. At this point I don't know whether its worth the wait Or if it's just millions of miles to re
EdwinJsHispanic:
"poem" love is So Beautiful to have. But it's so hard to have. At this point I don't know whether its worth the wait Or if it's just millions of miles to re
EdwinJsHispanic:
"poem" love is So Beautiful to have. But it's so hard to have. At this point I don't know whether its worth the wait Or if it's just millions of miles to re
EdwinJsHispanic:
"poem" love is So Beautiful to have. But it's so hard to have. At this point I don't know whether its worth the wait Or if it's just millions of miles to re
 Breathless:
I don't know if this would be considered art, but its close enough I believe, Any
Breathless:
I don't know if this would be considered art, but its close enough I believe, Any