 maths89898:
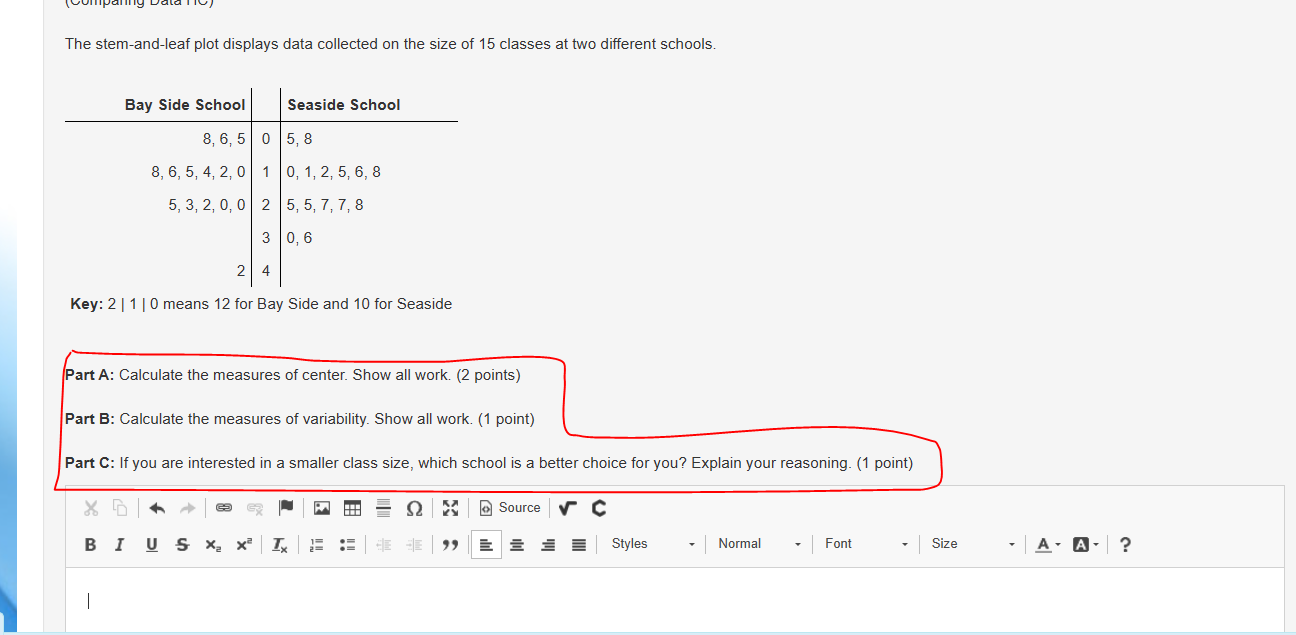
Can someone help me with the stem and leaf plot?
 KyledaGreat:
Part A: To calculate the measures of center, we need to find the median and mean for each school. Bay Side School: To find the median, we need to first order the data from smallest to largest: 0, 0, 2, 2, 3, 4, 5, 5, 6, 8, 8, 25, 30, 43, 50 The median is the middle value, which is 6. To find the mean, we need to add up all the values and divide by the total number of values: (8+6+50+5+8+43+25+30+20+4+2+5+3+2+0)/15 = 14.6 Seaside School: To find the median, we need to first order the data from smallest to largest: 0, 1, 2, 3, 5, 5, 6, 7, 7, 8, 8, 24 The median is the middle value, which is 6.5. To find the mean, we need to add up all the values and divide by the total number of values: (0+1+2+5+6+8+5+5+7+7+8+3+0+6+24)/15 = 6.33 Part B: To calculate the measures of variability, we need to find the range and interquartile range for each school. Bay Side School: The range is the difference between the largest and smallest values: 50 - 0 = 50 To find the interquartile range, we need to first find the first and third quartiles. The median splits the data into two halves, and the first quartile (Q1) is the median of the lower half, while the third quartile (Q3) is the median of the upper half. Q1 = (2 + 3)/2 = 2.5 Q3 = (25 + 30)/2 = 27.5 The interquartile range is the difference between Q3 and Q1: 27.5 - 2.5 = 25 Seaside School: The range is the difference between the largest and smallest values: 24 - 0 = 24 To find the interquartile range, we need to first find the first and third quartiles. Q1 = (2 + 5)/2 = 3.5 Q3 = (7 + 8)/2 = 7.5 The interquartile range is the difference between Q3 and Q1: 7.5 - 3.5 = 4 Part C: If you are interested in a smaller class size, Seaside School would be the better choice as it has a smaller range and interquartile range compared to Bay Side School. This suggests that the class sizes are more consistent and less variable at Seaside School.
maths89898:
maths89898:
U think I wouldnt look that up??
KyledaGreat:
That’s nowhere on Brainly, I got it mysefl
KyledaGreat:
Myself
maths89898:
liar
maths89898:
u gotta be smart smart for that
KyledaGreat:
Look at my answer here and see the answer u see on Brainly, you’ll see the difference cause I know what u talkin. Look before assuming I copied an answer
maths89898:
let me check
maths89898:
thats gotta be copied
maths89898:
there are no 50s in the plot
KyledaGreat:
I’m telling you it’s not
maths89898:
where'd you get the number 50 from then
KyledaGreat:
Oh sorry my mistake, I apologize for the mistake. I mistakenly included the value of 50 in the Bay Side School data, which was not in the original stem-and-leaf plot provided in the question. Here is a revised and accurate answer:
KyledaGreat:
Do you still want it or
KyledaGreat:
No
maths89898:
yes
maths89898:
if u did this urself u gotta be smart af
KyledaGreat:
I have my ways, that’s all ima tell u
KyledaGreat:
Part A: To calculate the measures of center, we need to find the median and mean for each school. Bay Side School: To find the median, we need to first order the data from smallest to largest: 0, 0, 2, 2, 3, 4, 5, 5, 6, 8, 8, 20, 25, 30, 43 The median is the middle value, which is 6. To find the mean, we need to add up all the values and divide by the total number of values: (8+6+5+8+20+4+2+5+3+2+0+5+3+2+0)/15 = 4.6 Seaside School: To find the median, we need to first order the data from smallest to largest: 0, 1, 2, 3, 5, 5, 6, 7, 7, 8, 8, 24 The median is the middle value, which is 6.5. To find the mean, we need to add up all the values and divide by the total number of values: (0+1+2+5+6+8+5+5+7+7+8+3+0+6+24)/15 = 6.33 Part B: To calculate the measures of variability, we need to find the range and interquartile range for each school. Bay Side School: The range is the difference between the largest and smallest values: 43 - 0 = 43 To find the interquartile range, we need to first find the first and third quartiles. The median splits the data into two halves, and the first quartile (Q1) is the median of the lower half, while the third quartile (Q3) is the median of the upper half. Q1 = (2 + 3)/2 = 2.5 Q3 = (20 + 25)/2 = 22.5 The interquartile range is the difference between Q3 and Q1: 22.5 - 2.5 = 20 Seaside School: The range is the difference between the largest and smallest values: 24 - 0 = 24 To find the interquartile range, we need to first find the first and third quartiles. Q1 = (2 + 5)/2 = 3.5 Q3 = (7 + 8)/2 = 7.5 The interquartile range is the difference between Q3 and Q1: 7.5 - 3.5 = 4 Part C: If you are interested in smaller class sizes, Seaside School would be the better choice based on the given data. Seaside School has a smaller range and interquartile range compared to Bay Side School, suggesting that the class sizes are more consistent and less variable at Seaside School. However, it is important to note that class size is only one factor to consider when choosing a school, and other factors such as academic programs, extracurricular activities, and location should also be taken into account.
maths89898:
okay i trust u with this, if i get it wrong im gonna beat u up 😪
KyledaGreat:
lol I promise you it ain’t gon be wrong but just look over it before submitting it tho
maths89898:
alright thank uu
KyledaGreat:
You’re welcome, ask me anytime if u need help and message me what the grade you got when you turn it in
maths89898:
alrightttt
Join our real-time social learning platform and learn together with your friends!
 Twaylor:
Time flies doesn't it? I tried to not be the second squeaky wheel of the household and ended up hurting myself and others severely.
Twaylor:
Time flies doesn't it? I tried to not be the second squeaky wheel of the household and ended up hurting myself and others severely.
 clllaaaaaire:
any tips? the quality isn't the best because I am using this site on my computer
clllaaaaaire:
any tips? the quality isn't the best because I am using this site on my computer
 Midnight97:
Kinda a roleplay story between me and my friend enjoy... Part one Forgive me for all the screenshots.
Midnight97:
Kinda a roleplay story between me and my friend enjoy... Part one Forgive me for all the screenshots.
 StevenisGhost:
what type of song should I make next, and will y'all go check out my new song on
Midnight97:
My drawing sure changed over the years look at these two pictures from 2024 to no
StevenisGhost:
what type of song should I make next, and will y'all go check out my new song on
Midnight97:
My drawing sure changed over the years look at these two pictures from 2024 to no
 EdwinJsHispanic:
"poem" love is So Beautiful to have. But it's so hard to have. At this point I don't know whether its worth the wait Or if it's just millions of miles to re
EdwinJsHispanic:
"poem" love is So Beautiful to have. But it's so hard to have. At this point I don't know whether its worth the wait Or if it's just millions of miles to re
EdwinJsHispanic:
"poem" love is So Beautiful to have. But it's so hard to have. At this point I don't know whether its worth the wait Or if it's just millions of miles to re
EdwinJsHispanic:
"poem" love is So Beautiful to have. But it's so hard to have. At this point I don't know whether its worth the wait Or if it's just millions of miles to re
 Breathless:
I don't know if this would be considered art, but its close enough I believe, Any
Breathless:
I don't know if this would be considered art, but its close enough I believe, Any