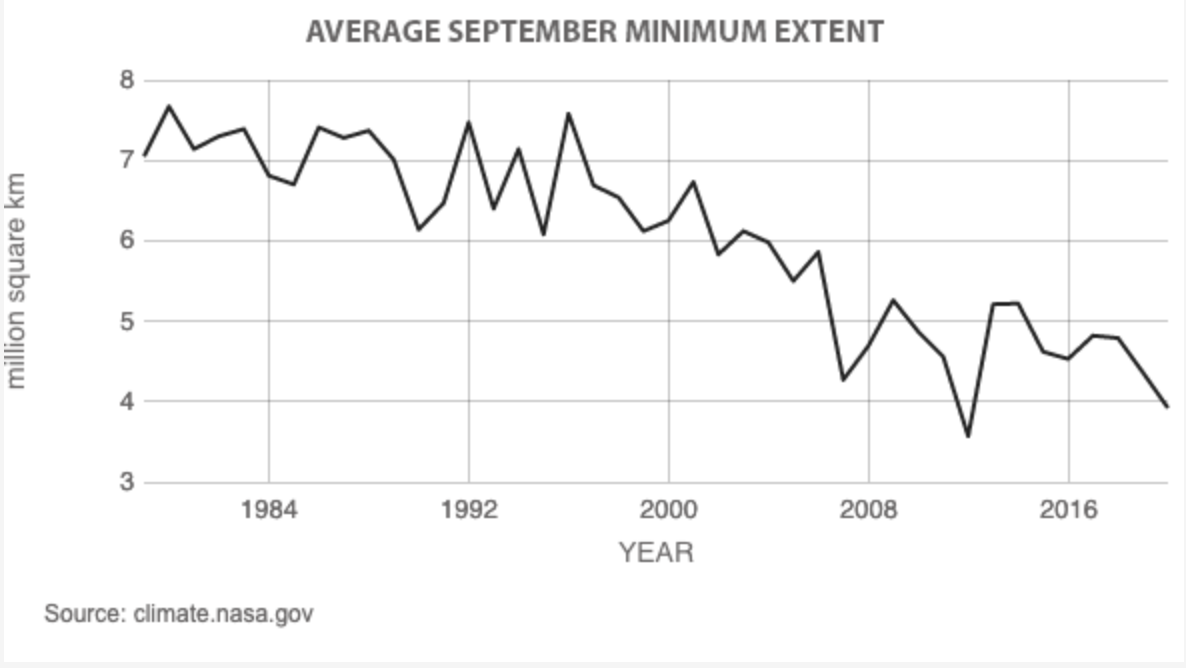
(04.05 MC) Arctic sea ice melts back during the summer and grows or "recovers" during winter. The maximum amount of ice (ice extent) is usually reached in March. The graph below shows the amount of Arctic sea ice every September since 1984. Graph shows Arctic ice extent every September since 1984, which was approximately seven million square kilometers. In 1992, the Arctic ice extent was still averaging seven million square kilometers. By 2000, the Arctic ice extent was six million square kilometers. By 2008, the Arctic ice extent was four and a half million square kilometers. By 2016, the Arctic ice extent was four and a half million square kilometers after a dip to three and half million square kilometers in 2012. © 2021 NSIDC/NASA At what point in the data is climate change evident by Arctic ice melting? Arctic ice extent in the year 2016 is equal to Arctic ice extent in 1984. Arctic ice extent is highest in September 2016 and lowest in 1984. In 2016, Arctic ice had decreased by half compared to 1984. The Arctic ice extent was highest between 2000 and 2016
 2hrs:
2hrs:
In the year 2016, the Arctic ice extent was four and a half million square kilometers, which is a significant decrease compared to the approximate seven million square kilometers recorded in 1984. Additionally, the dip to three and a half million square kilometers in 2012 further highlights the trend of decreasing Arctic ice extent. The consistent decrease in Arctic ice extent from 1984 to 2016, with a notable drop in 2012 and a lower average extent in 2016 compared to earlier years, provides strong evidence of climate change influencing the melting of Arctic sea ice.
lalalalala
Join our real-time social learning platform and learn together with your friends!

 Twaylor:
Time flies doesn't it? I tried to not be the second squeaky wheel of the household and ended up hurting myself and others severely.
Twaylor:
Time flies doesn't it? I tried to not be the second squeaky wheel of the household and ended up hurting myself and others severely.
 clllaaaaaire:
any tips? the quality isn't the best because I am using this site on my computer
clllaaaaaire:
any tips? the quality isn't the best because I am using this site on my computer
 Midnight97:
Kinda a roleplay story between me and my friend enjoy... Part one Forgive me for all the screenshots.
Midnight97:
Kinda a roleplay story between me and my friend enjoy... Part one Forgive me for all the screenshots.
 StevenisGhost:
what type of song should I make next, and will y'all go check out my new song on
Midnight97:
My drawing sure changed over the years look at these two pictures from 2024 to no
StevenisGhost:
what type of song should I make next, and will y'all go check out my new song on
Midnight97:
My drawing sure changed over the years look at these two pictures from 2024 to no
 EdwinJsHispanic:
"poem" love is So Beautiful to have. But it's so hard to have. At this point I don't know whether its worth the wait Or if it's just millions of miles to re
EdwinJsHispanic:
"poem" love is So Beautiful to have. But it's so hard to have. At this point I don't know whether its worth the wait Or if it's just millions of miles to re
EdwinJsHispanic:
"poem" love is So Beautiful to have. But it's so hard to have. At this point I don't know whether its worth the wait Or if it's just millions of miles to re
EdwinJsHispanic:
"poem" love is So Beautiful to have. But it's so hard to have. At this point I don't know whether its worth the wait Or if it's just millions of miles to re